Reduce Istio Sidecar metric cardinality
How to configure the Istio stats EnvoyFilter to reduce the cardinality of metrics in istio-proxy to greatly reduce the load on Prometheus

Following on from my previous post which was primarily focused on how to handle high cardinality metrics once they reach prometheus, this post is focused on reducing that cardinality at source - at istio-proxy itself.
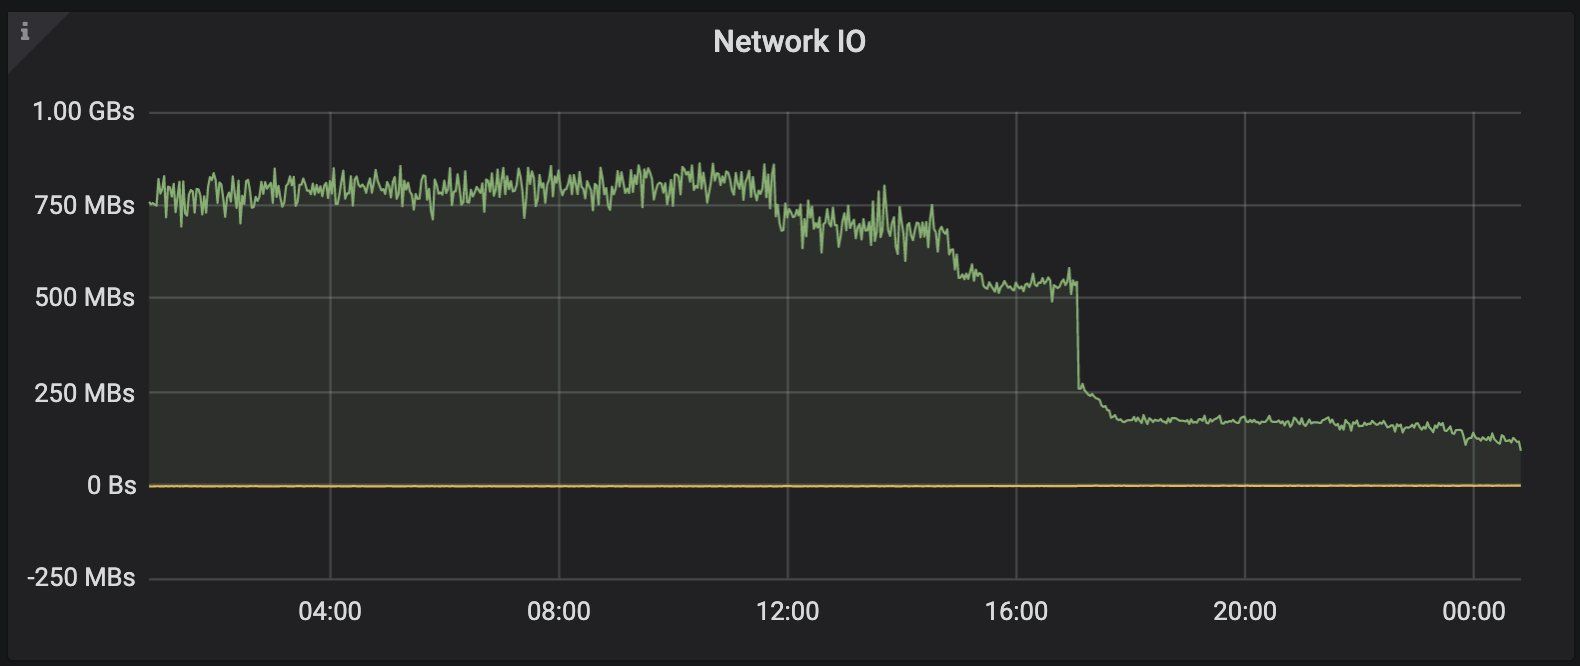
When you're running 1000's of Sidecars, small changes can have significant impact. Using the steps I've described below, I was able to reduce the data that Prometheus was scraping from istio-proxy on one of our busiest clusters from ~800mbps, down to sub 150, without impacting our Dashboards or Alerts in any way.
The average memory consumption of istio-proxy across our estate dropped about 20% as well, due to the proxies not needing to store nearly as much metric data.
Note: The final solution is entirely dependent on how you're using these metrics! You'll need to decide what dimensions give value to you, and adjust all of this according to your needs.
Telemetry V2 Custom Metrics - Removing Dimensions
Added in Istio 1.5 was the ability to customise the metrics that the istio-proxy generates. One of the simplest things you can do is make use of tags_to_remove in your EnvoyFilter, in order to remove dimensions that you're not interested in.
So for example, in my previous post, you'll have noticed on the request_size, response_size and duration histogram buckets, I was rolling up in such a way that I was removing response_code and response_flags, like so:
- name: istio.workload.istio_response_bytes_bucket
  interval: 10s
  rules:

  - record: federate:istio_response_bytes_bucket:rate1m
    expr: |
      sum(irate(istio_response_bytes_bucket{reporter="source", source_workload!=""}[1m]))
      by (
        source_workload,
        source_workload_namespace,
        destination_service,
        destination_workload,
        destination_workload_namespace,
        le
      )
This is because we capture all the information that we're interested in with regards to response codes and flags from the istio_requests_total metric, and we're not interested in seeing request and response sizes sliced by response code or flags. Whilst this rollup certainly does the job, it'd be much better if it happened at each istio-proxy, to lower the load on the whole system.
If you look in your Istio installation, you'll find there is a networking.istio.io/v1alpha3/EnvoyFilter named stats-filter-1.5. This EnvoyFilter is what instructs istio-proxy to record metrics for Prometheus to scrape. You want to find the following section:
...
config:
  root_id: stats_outbound
  configuration: |
    {
      "debug": "false",
      "stat_prefix": "istio",
    }
...
It should appear three times, in three different patch sections, SIDECAR_INBOUND, which is used to generate metrics of reporter=destination, SIDECAR_OUTBOUND, which is used to report reporter=source, and GATEWAY. You'll need to modify each of them. This is how mind ended up looking:
...
config:
  root_id: stats_outbound
  configuration: |
    {
      "debug": "false",
      "stat_prefix": "istio",
      "metrics": {
        "tags_to_remove": ["destination_canonical_service", "source_canonical_service", "destination_principal", "source_principal", "connection_security_policy", "grpc_response_status", "source_version", "destination_version", "request_protocol", "source_canonical_revision", "destination_canonical_revision"]
      },
      "metrics": {
        "name": "request_duration_milliseconds",
        "tags_to_remove": ["response_code", "response_flags"],
      },
      "metrics": {
        "name": "request_bytes",
        "tags_to_remove": ["response_code", "response_flags"],
      },
      "metrics": {
        "name": "response_bytes",
        "tags_to_remove": ["response_code", "response_flags"],
      }
    }
...
The metrics block is Repeatable, and the rules are additive. The name tag is optional, if omitted it is applied to all metrics. The example above will:
- Remove a handful of dimensions from all metrics (due to the omission of the
nametag), things likegrpc_response_status, that aren't useful to us at all. - Then specifically on the
request_bytes,response_bytesanddurationbuckets, remove theresponse_codeandresponse_flags.
This is important, particularly on histogram buckets, because they are already high cardinality. Each metric exposes 20 le dimensions, if your application returned, say, 10 different status codes, you'll end up with 200 permutations of the bucket metric being returned for that particular source -> destination. The same bucket will also be recorded in both the source, and destination istio-proxy, which for some of us - might be overkill.
Telemetry V2 Custom Metrics - Removing Destination
Which leads us onto this, which is a little more drastic, but carries big gains as in one swoop, will cut the metrics you generate in half. For us, this is because when we're observing services, we're primarily interested in the perspective of the source application.
For example, service-a -> service-b. service-a will report connection problems, like 502's, or 0DCs, whereas - service-b will not as the request never got there. In fact for us, after two years, the only value service-b metrics provided was to allow us to loosely calculate the network latency between a and b. However, storing them:
- Doubles the load on Prometheus, as you're storing the same request from both the source an destination perspective
- Adds load to the sidecars, as they're having to report both incoming and outgoing requests
The value just wasn't high enough to warrant the cost, so we turned them off.
This is very easily done, in the same EnvoyFilter as before - simply remove the SIDECAR_INBOUND section and voila, reporter=destination metrics will no longer be recorded.
Summary
As I've said quite a few times in the past, Istio out of the box has most things turned on to enable you to find your feet and learn what you need. However at scale, you will need to start tweaking it to meet your requirements, and those requirements are not going to be the same across all users.
Hopefully this blog helps you configure Istios V2 metrics to meet the specific needs of your problem space!