Federated Prometheus to reduce Metric Cardinality
How to reduce Istio metric cardinality following a migration to telemetry v2 - using Prometheus Federation and Rollup recording rules

Istio is soon to release telemetry-v2 to the wild. In many ways this is a great step forward, some of the key features are:
- No mixer deployed on your cluster to receive metrics from sidecars. Mixer required a lot of resources to run (~0.5 vCPU per 1000 rps of mesh traffic)
- ~10% less CPU load on the sidecars
- Pod level service metrics, if you so desire them
Sounds rosey, right? Unfortunately whilst fixing some problems, it will introduce another key issue: massively increased cardinality. In this blog I'm going to explore the reason why, and explain how you can handle this using a tiered prometheus setup, and recording rules to remove cardinality. In our case, we reduced our metrics by 97%.
Telemetry V1
So a bit of history. V1 had mixer as an aggregation point, all Sidecars sent their metrics to mixer and then prometheus scraped mixer, like this:
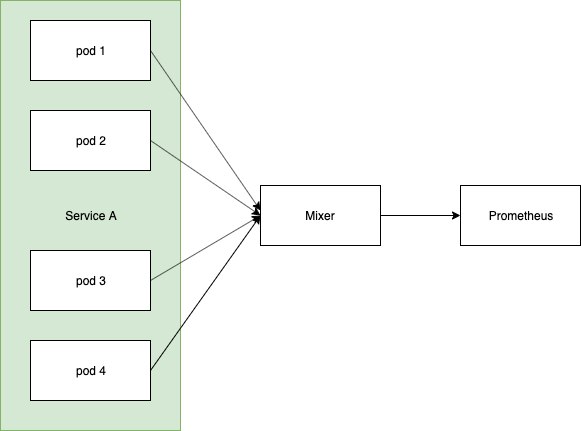
Effectively what you ended up with in prometheus were metrics sliced by the number of mixer pods you were running:
istio_requests_total{app="something", instance="mixer-ip"}
When you were then drawing dashboards, or running queries, you were only aggregating across N mixer instances.
Telemetry V2
Jump to today and Metrics are scraped by Prometheus directly and that middle mixer has gone, so every metric now has a cardinality of pod_name instead:
istio_requests_total{app="something", pod_name="your-pod-name"}
This leads to a significant increased in Memory and CPU requirements for Prometheus, especially if you have high turnover (lots of deployments, so lots of pod name changes) and your queries regularly aggregate these metrics. You'll very quickly OOM. Grafana will grind to a halt as well as the queries are taking so long to evaluate in Promethus.
Eeek. Not great, but we can do something about it. We can simulate mixers old rollup behaviour using Prometheus Federation and roll-up recording rules.
Rolling Up
So on to rolling up, to remove the pod_name cardinality and get us back to a concise set of service metrics.
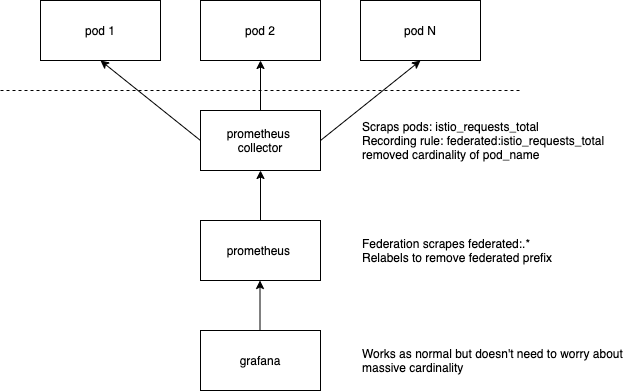
In this example I'm going to do that by having two prometheus servers. One called collector which has a very short tsdb retention (2 hours) and another called master which has our rolled up, long term storage:
Creating the Collector
The collector is going to be scraping our pods (envoy) directly. You can use the Istio standard configuration for this.
You want to configure your collector to have a short storage retention, for example: --storage.tsdb.retention.time=2h (2h is the minimum block size). So go ahead and set that up.
At this point your metrics will be being scraped into your collector, and thrown away after about six hours. They have a very high cardinality, so In order to role them up to remove the pod_name, you need to create some recording rules which aggregate and remove those labels you're not interested in.
Before we continue, there's some prometheus terminology I just want to clarify. Prometheus groups are a collection of rules. Groups run in parallel and the rules within each group run in series. This becomes important for reasons I'll explain further down.
By convention, I'm going to create recording rules that are prefixed with federate:. This will make more sense further down when we configure the top level master prometheus.
Rolling up - Workload
In our cluster, the most expensive rules to evaluate were those removing the pod_name labels, are they are rolling up a lot of data. As a result, the first thing we set up were some rules to capture that data at the workload level.
- name: istio.workload.istio_request_duration_milliseconds_bucket
  interval: 10s
  rules:

  - record: federate:istio_request_duration_milliseconds_bucket:rate1m
    expr: |
     sum(irate(istio_request_duration_milliseconds_bucket{reporter="source", source_workload!=""}[1m]))
      by (
        source_workload,
        source_workload_namespace,
        destination_service,
        destination_workload,
        destination_workload_namespace,
        le
      )

- name: istio.workload.istio_request_bytes_bucket
  interval: 10s
  rules:

  - record: federate:istio_request_bytes_bucket:rate1m
    expr: |
      sum(irate(istio_request_bytes_bucket{reporter="source", source_workload!=""}[1m]))
      by (
        source_workload,
        source_workload_namespace,
        destination_service,
        destination_workload,
        destination_workload_namespace,
        le
      )

- name: istio.workload.istio_response_bytes_bucket
  interval: 10s
  rules:

  - record: federate:istio_response_bytes_bucket:rate1m
    expr: |
      sum(irate(istio_response_bytes_bucket{reporter="source", source_workload!=""}[1m]))
      by (
        source_workload,
        source_workload_namespace,
        destination_service,
        destination_workload,
        destination_workload_namespace,
        le
      )

- name: istio.workload.istio_requests_total
  interval: 10s
  rules:
  - record: federate:istio_requests_total:rate1m
    expr: |
      sum(irate(istio_requests_total{reporter="source", source_workload!=""}[1m]))
      by (
        source_workload,
        source_workload_namespace,
        destination_service,
        destination_workload,
        destination_workload_namespace,
        response_code,
        response_flags
      )
Note the interesting part here, each rule goes into its own group, this is intentional as each rule takes about 4-5 seconds to evaluate on our instance. Remember how I said earlier that rules are evaluated in series, within a group. Therefore, if they were in the same group, this it would take 16-20s to complete evaluation.
This is extremely important, especially when you're visualising your data in grafana. If your rule group is taking 30+ seconds to run, your graphs are going to look very clunky, as you only have a snapshot of the data every 30 seconds.
For for us, with each group taking 4-5s, plus the 10 second interval means we get the rule recorded around every 15 seconds. Which loosely matches our step_interval in grafana. Perfect.
Rolling up - Rates/Optimisations
You might be able to stop at this point, and just act on the workload rollup rules above. It all comes down to how much data you have, and how you responsive you want your dashboard to be (especially over longer time windows).
However, if like us you're regularly graphing things like, 50th percentile request duration in a variety of different places - it's wasteful to always perform that histogram_quantile, so you can add additional rules for those too:
# These rules should be fast, and only operate on the aggregates defined above
- name: istio.recording-rules-percentiles
  interval: 10s
  rules:

  - record: federate:istio_request_duration_milliseconds_bucket:rate1m
    expr: |
      label_replace(
        histogram_quantile(0.50,
          federate:istio_request_duration_milliseconds_bucket:rate1m
        )
      , "percentile", "50", "source_workload", ".*")
Note that this rule acts on the previously recorded federate:istio_request_duration_milliseconds_bucket:rate1m, making it extremely fast to evaluate.
If you're interested, I've put all of our recording rules on a gist.
Creating the Master
Your top level prometheus is going to have the long term retention. It's going to be where your grafana dashboards query the federated data that you've defined above.
Configuring Federation
Prometheus supports federation right out of the box, it's very simple, just add this block to your scrape config:
scrape_configs:
- job_name: 'federate'
  scrape_interval: 10s
  honor_labels: true
  metrics_path: '/federate'
  params:
    'match[]':
      - '{__name__=~"federate:(.*)"}'
  static_configs:
  - targets:
    - 'collector:9090'
  metric_relabel_configs:
  - source_labels: [__name__]
    regex: 'federate:(.*)'
    target_label: __name__
    action: replace
There are a couple of important points here. Firstly, we're telling prometheus to only scrape metrics that start with federate:, this is why that convention earlier was important.
Secondly, we then relabel the metric to remove the federate: prefix. Meaning in our top level prometheus our metrics will be clearer. federate:istio_request_bytes_bucket:rate1m becomes istio_request_bytes_bucket:rate1m.
And that's it, that's literally all you need to do. At this point you should have metrics being federated into your top level prometheus! You can get an idea of the savings by running count({__name__=~"istio.*"}) in both your collector and master. In our case:
- collector:
count({__name__=~"istio.*"}) 337635 - master:
count({__name__=~"istio.*"}) 10143
An unbelievable reduction. To put this into context, we have 330 workloads with over 1000 pods and our production prometheus is running using 2.5GB memory.
Gotchas
Rate then sum, never sum then rate
It's important to remember that you can never sum, then rate. Subsequently if you're wanting to explore your data in a more free form manner (say you want to look at istio_requets_total with a rate of 10m, you'll need to do that on your collector, not on your top level prometheus.
This is why you generate rollup federate:istio_requests_total:rate1m metrics on your collector, and not by doing sum(irate(federate:istio_requests_total:sum[1m])) on your master.
Alert from your collector, not your master
For many of the same reasons above, plus any delay in metrics getting to your master, move any alerting rules you have to your collector. You can push them through the same alertmanager of course.
Any questions - ask in the comments below!