Using EnvoyFilters to Debug Requests
Using EnvoyFilter to debug HTTP requests, and locate those missing important tracing headers

At AutoTrader, we've got a large (400+) microservice architecture, and many requests to autotrader.co.uk could traverse 10+ services in order to build the response. Being able to visualise that as a trace has been on of the most valuable improvements we've made to our platform in recent years, significantly reducing the time we spend debugging problems, and lowered our mean-time to recovery during incidents.
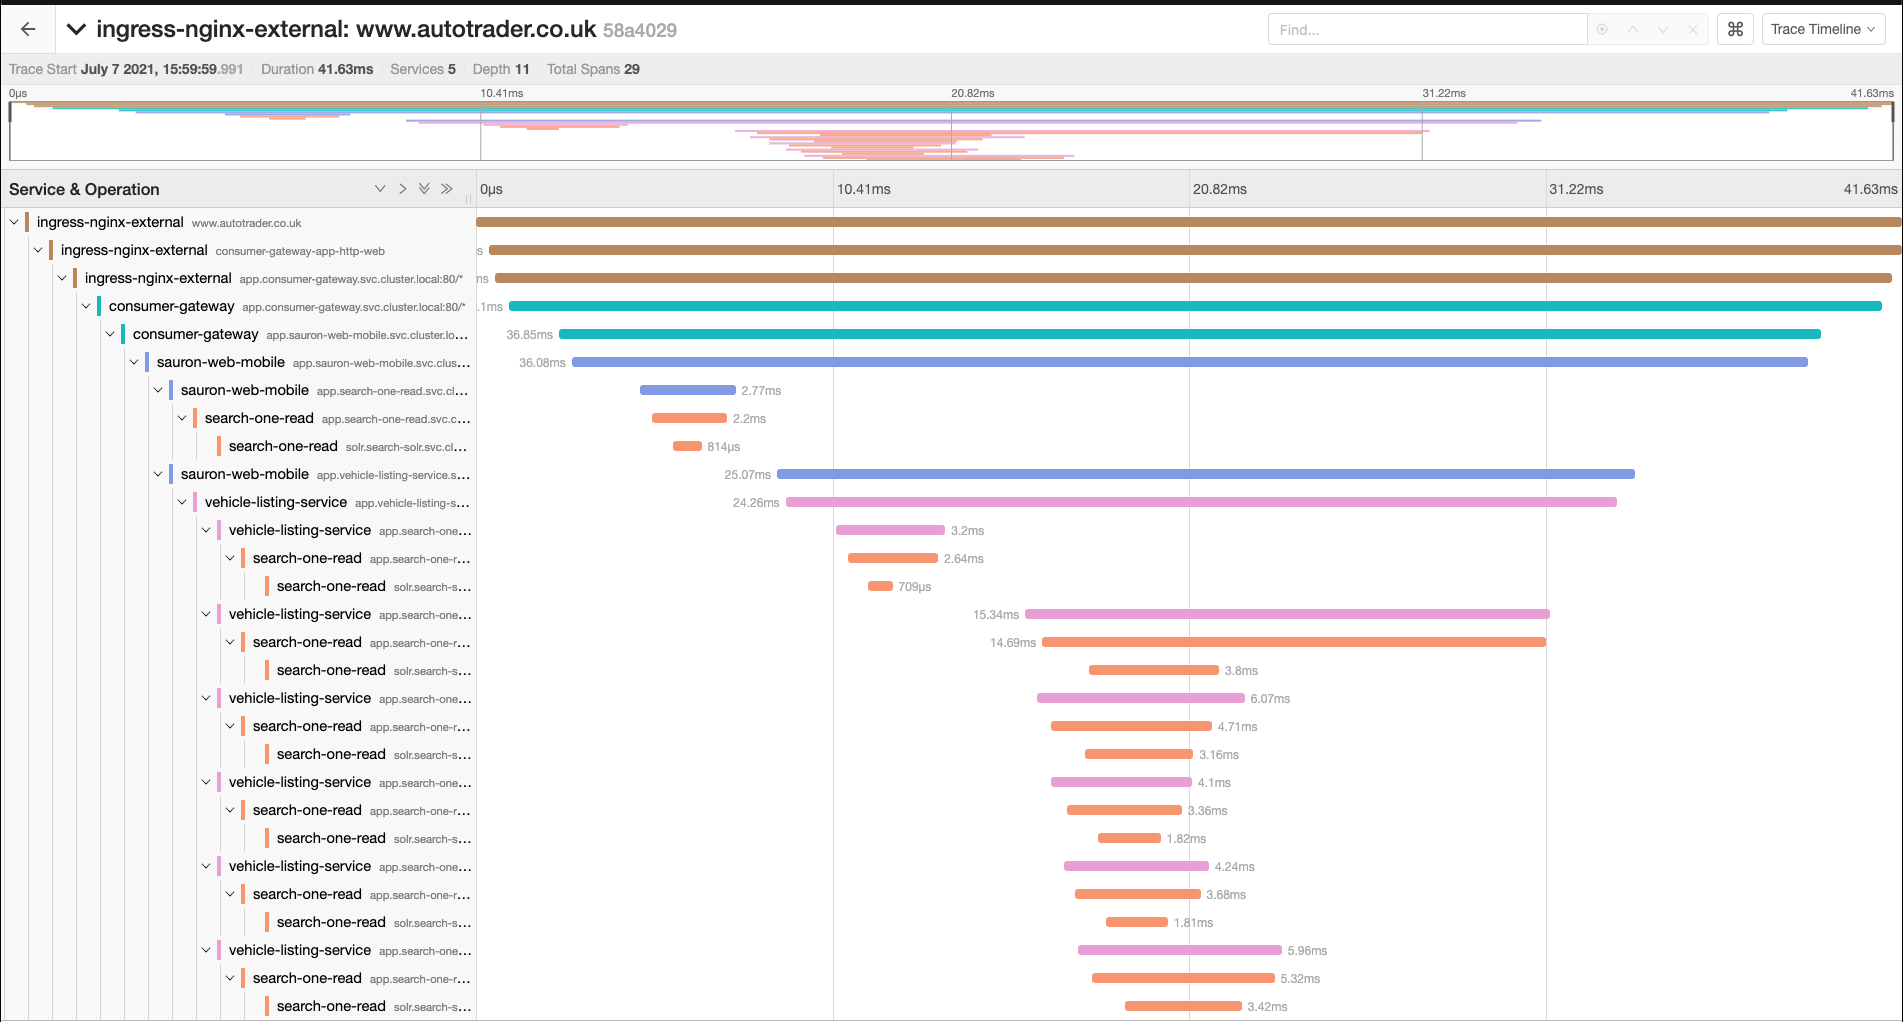
One of the most valuable aspects of using Istio is how simple it makes distributed tracing using Jaeger. We don't need libraries in our applications (of many different languages) to wrangle spans, and report those back to a collector (that they'd need to know the address of). Instead, all we need our developers to do is forward these headers and the Istio proxy takes care of the rest.
x-request-idx-b3-spanidx-b3-traceidx-b3-parentspanidx-b3-sampledx-b3-flags
So what's the problem?
We've found ourselves in incidents with incomplete traces, and that's usually because:
- The developers simply aren't forwarding the tracing headers in that application, so the trace ends there
- The header forwarding has been implemented incorrectly (people using
addinstead ofseton their http header collection, and creating a CSV likex-b3-traceid: traceid,traceid,traceid)
Debugging this typically consisted of turning on request logs for the whole service, and parsing that for requests missing this key information.
That's really hard when you've got a service doing 1000's of requests per second, and only a handful are invalid. It's also risky, logging out the whole request can contain sensitive information that we don't want in log files.
Using EnvoyFilters
Istio gives us the ability to insert EnvoyFilters into the request chain, which in this example enable us to inject some lua script into the processing pipeline.
The key bits to note here are that we're applying the config to the HTTP_FILTER, and specifically the SIDECAR_OUTBOUND http.route filterChain. The workloadSelector needs to select your sidecar.
In that lua script, we look for our problem scenario (in this case, outbound requests that are missing tracing headers, or outbound requests that are not sampled - which shouldn't happen for us) and log that to the istio-proxy logs.
We also filter out some headers that contain sensitive information, such as the cookie, and authorization.
apiVersion: networking.istio.io/v1alpha3
kind: EnvoyFilter
metadata:
  name: log-missing-outgoing-tracing-headers
  namespace: insert-app-namespace-here
  annotations:
    name: Log Missing Trace Data (outgoing)
    description: Logs outbound requests that are missing tracing headers to the istio-proxy logs
spec:
  workloadSelector:
    labels:
      app: insert-app-name-here
  configPatches:
    - applyTo: HTTP_FILTER
      match:
        context: SIDECAR_OUTBOUND
        listener:
          filterChain:
            filter:
              name: 'envoy.filters.network.http_connection_manager'
              subFilter:
                name: 'envoy.filters.http.router'
      patch:
        operation: INSERT_BEFORE
        value:
          name: envoy.lua
          typed_config:
            '@type': 'type.googleapis.com/envoy.extensions.filters.http.lua.v3.Lua'
            inlineCode: |
              local function isempty(s)
                return s == nil or s == ''
              end

              local function print_headers(err, request_headers)
                local authority = request_headers:get(":authority")
                print(string.format("%s:", authority))
                print(string.format(" - Error: %s", err))
                for key, value in pairs(request_headers) do
                  if (key == "authorization" or key == "cookie") then
                    print(string.format(" - %s: %s", tostring(key), 'hidden'))
                  elseif not (key == "x-forwarded-client-cert" or key == ":authority" or string.find(key, "x-envoy")) then
                    print(string.format(" - %s: %s", tostring(key), tostring(value)))
                  end
                end

                print("")
              end

              function envoy_on_request(request_handle)
                local request_headers = request_handle:headers()
                local traceId = request_headers:get("x-b3-traceid")
                local sampled = request_headers:get("x-b3-sampled")

                if isempty(traceId) then
                  print_headers("outbound request with no traceId", request_headers)
                elseif sampled == "0" then
                  print_headers("outbound request was not sampled", request_headers)
                end
              end
Simply kubectl apply this to the namespace of your app, and this the output, lovely logs telling us exactly which requests are missing the data we require:
app.native-apps-service.svc.cluster.local:
 - Error: outbound request with no traceId
 - :path: /api/v1_4/sss-proxy/fpa
 - :method: POST
 - :scheme: http
 - accept: application/json;charset=UTF-8
 - content-length: 719
 - content-type: application/json; charset=UTF-8
 - user-agent: Apache-HttpClient/4.5.13 (Java/11.0.11)
 - accept-encoding: gzip,deflate
 - x-forwarded-proto: http
 - x-request-id: 31f3097d-7dcb-4120-909c-4d8b1da56c9e
You can do exactly the same for inbound requests too, switch the context to SIDECAR_INBOUND and log out requests your app is receiving that aren't being sampled.
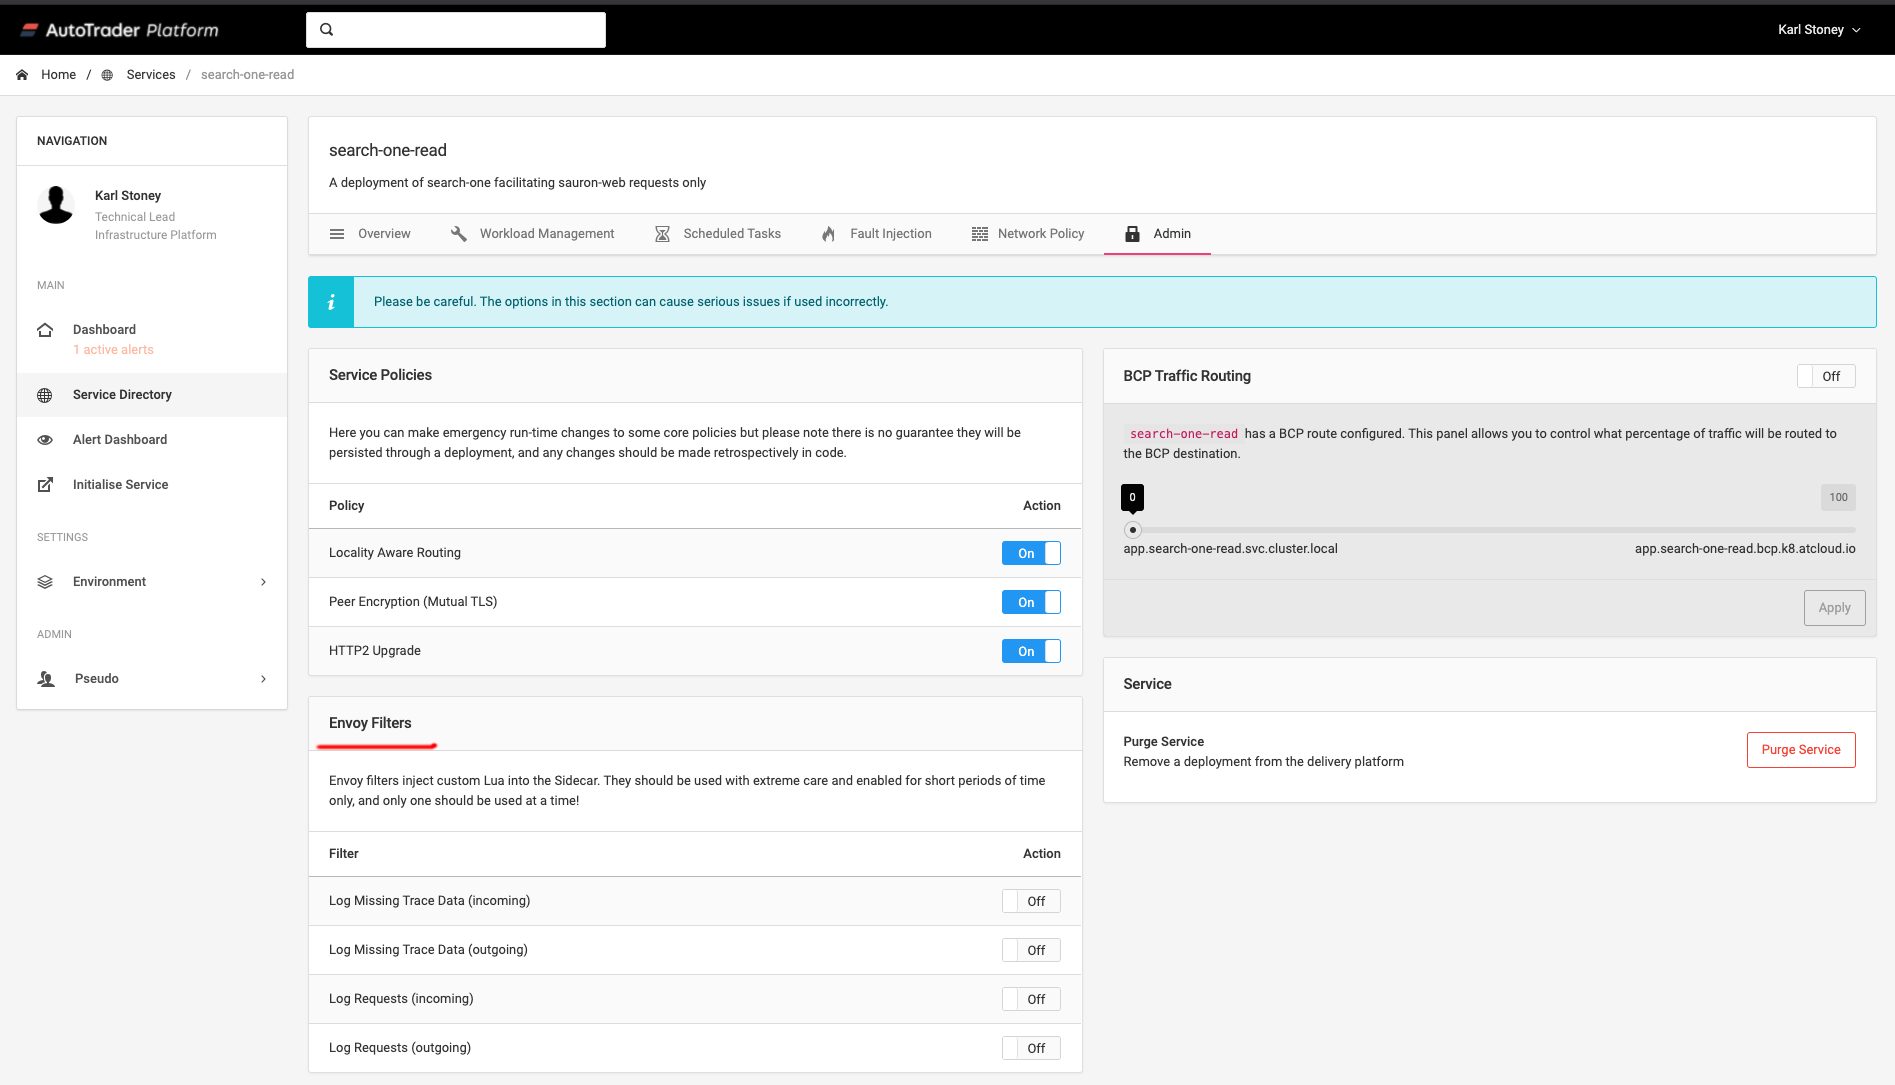
Making it Easy (and Safe) to Consume
EnvoyFilters are pretty powerful, but can be pretty destructive too, so we don't just let anyone use them. We expose a small set of pre-tested EnvoyFilters to the users of our platform to aid runtime debugging.
Summary
Hopefully this shows you just one example of how you could use EnvoyFilters to do quality checking of your HTTP requests.
Now we've got the tools to help debug the issue, the next step for us is to look at customising istio metrics to add a new sampled dimension to istio_requests_total, to give us some data we can alert on via prometheus, to alert the product teams to the problem. A blog post on that will follow once we get it working!