Speeding up Jaeger on Elasticsearch
How to improve the performance of Jaeger when using Elasticsearch as the storage backend.
We use Elasticsearch as a backend for Jaeger. We also don't sample, so we record every request. Subsequently that means we store a lot of data. To put a lot into perspective, yesterday we stored 4,523,923,888 spans, around 2TB. Eek.
We found that at this level of volume, you can't ignore your Elasticsearch configuration. Query performance will tank as the daily index grows and by the end of the day the Jaeger GUI can become almost unusable for searching. There was some chat about it here https://github.com/jaegertracing/jaeger/pull/1475, but it ended up being closed due to inactivity. So I've decided to share a blog to help others tune their Jaeger and ES relationship.
It's worth noting that we use Jaeger via the Istio integration. Some of the tags I talk about below might be different in your setup.
Field Mappings
By default, Jaeger will create an elasticsearch index template for you. That template isn't going to cut it; so you need to set ES_CREATE_INDEX_TEMPLATES=false. You'll then need to grab yourself a copy of the existing index template, either from Elasticsearch or Github, so we can start making some modifications.
I'm going to assume a base level of Elasticsearch knowledge from this point forward, so I won't be covering how to apply mapping templates to your cluster. You can read the Elasticsearch documentation on that here.
eager_global_ordinals
By far one of the biggest bang for buck changes you can make is enabling eager_global_ordinals on fields you regularly aggregate on. Ordinals are basically a unique number representation of string values. When you perform aggregations on those fields, Elasticsearch needs to calculate them at query time. When you have a lot of new data being ingested, there's always a lot of work to be done at query time. Setting eager_global_ordinals: true moves that compute time to ingestion. As you write your documents, that value will be calculated up front, drastically improving the performance at query time.
We dig into our data in various different ways so we ended up setting this flag on the following fields:
traceIDspanIDoperationNametag.http@urltag.upstream_clusterprocess.serviceName
URL tokenisation
We want to be able to search across the tag tag.http@url in a variety of different ways. Lets take an example of https://www.google.com/some/path?query1=a&query2=b. By default we're analysing that as keyword, which is a pretty reasonable default. It allows us to do exact and partial matching. But lets say we want to find all spans to the host www.google.com, we're suddenly having to do tag.http@url:*www.google.com*. A wildcard at both the start and the end will perform terribly especially on the amount of data we have. This is where tokenisation analysis comes in.
The following analyser will (crudely) split that URL up into segments representing the scheme, host, path, and querystring parameters.
{
  "template": {
    "settings": {
      "analysis": {
        "char_filter": {
          "custom_regex_split": {
            "type": "pattern_replace",
            "pattern": "(https?)://([^/\\?]+)(/[^\\?]+)?\\??(.*)?",
            "replacement": "$1_SPLIT_$2_SPLIT_$3_SPLIT_$4"
          }
        },
        "tokenizer": {
          "url_tokenizer": {
            "type": "pattern",
            "pattern": "_SPLIT_|&"
          }
        },
        "filter": {
          "remove_split": {
            "type": "pattern_replace",
            "pattern": "_split_",
            "replacement": ""
          },
          "remove_empty_filter": {
            "type": "stop",
            "stopwords": [""]
          }
        },
        "analyzer": {
          "custom_url_analyzer": {
            "type": "custom",
            "tokenizer": "url_tokenizer",
            "char_filter": ["custom_regex_split"],
            "filter": ["lowercase", "remove_split", "remove_empty_filter"]
          }
        }
      }
    },
    "mappings": {
      "dynamic_templates": [
        {
          "http_url": {
            "mapping": {
              "type": "text",
              "analyzer": "custom_url_analyzer",
              "fields": {
                "keyword": {
                  "type": "keyword",
                  "ignore_above": 256,
                  "eager_global_ordinals": true
                }
              }
            },
            "path_match": "tag.http@url"
          }
        }
      }
    }
  }
}
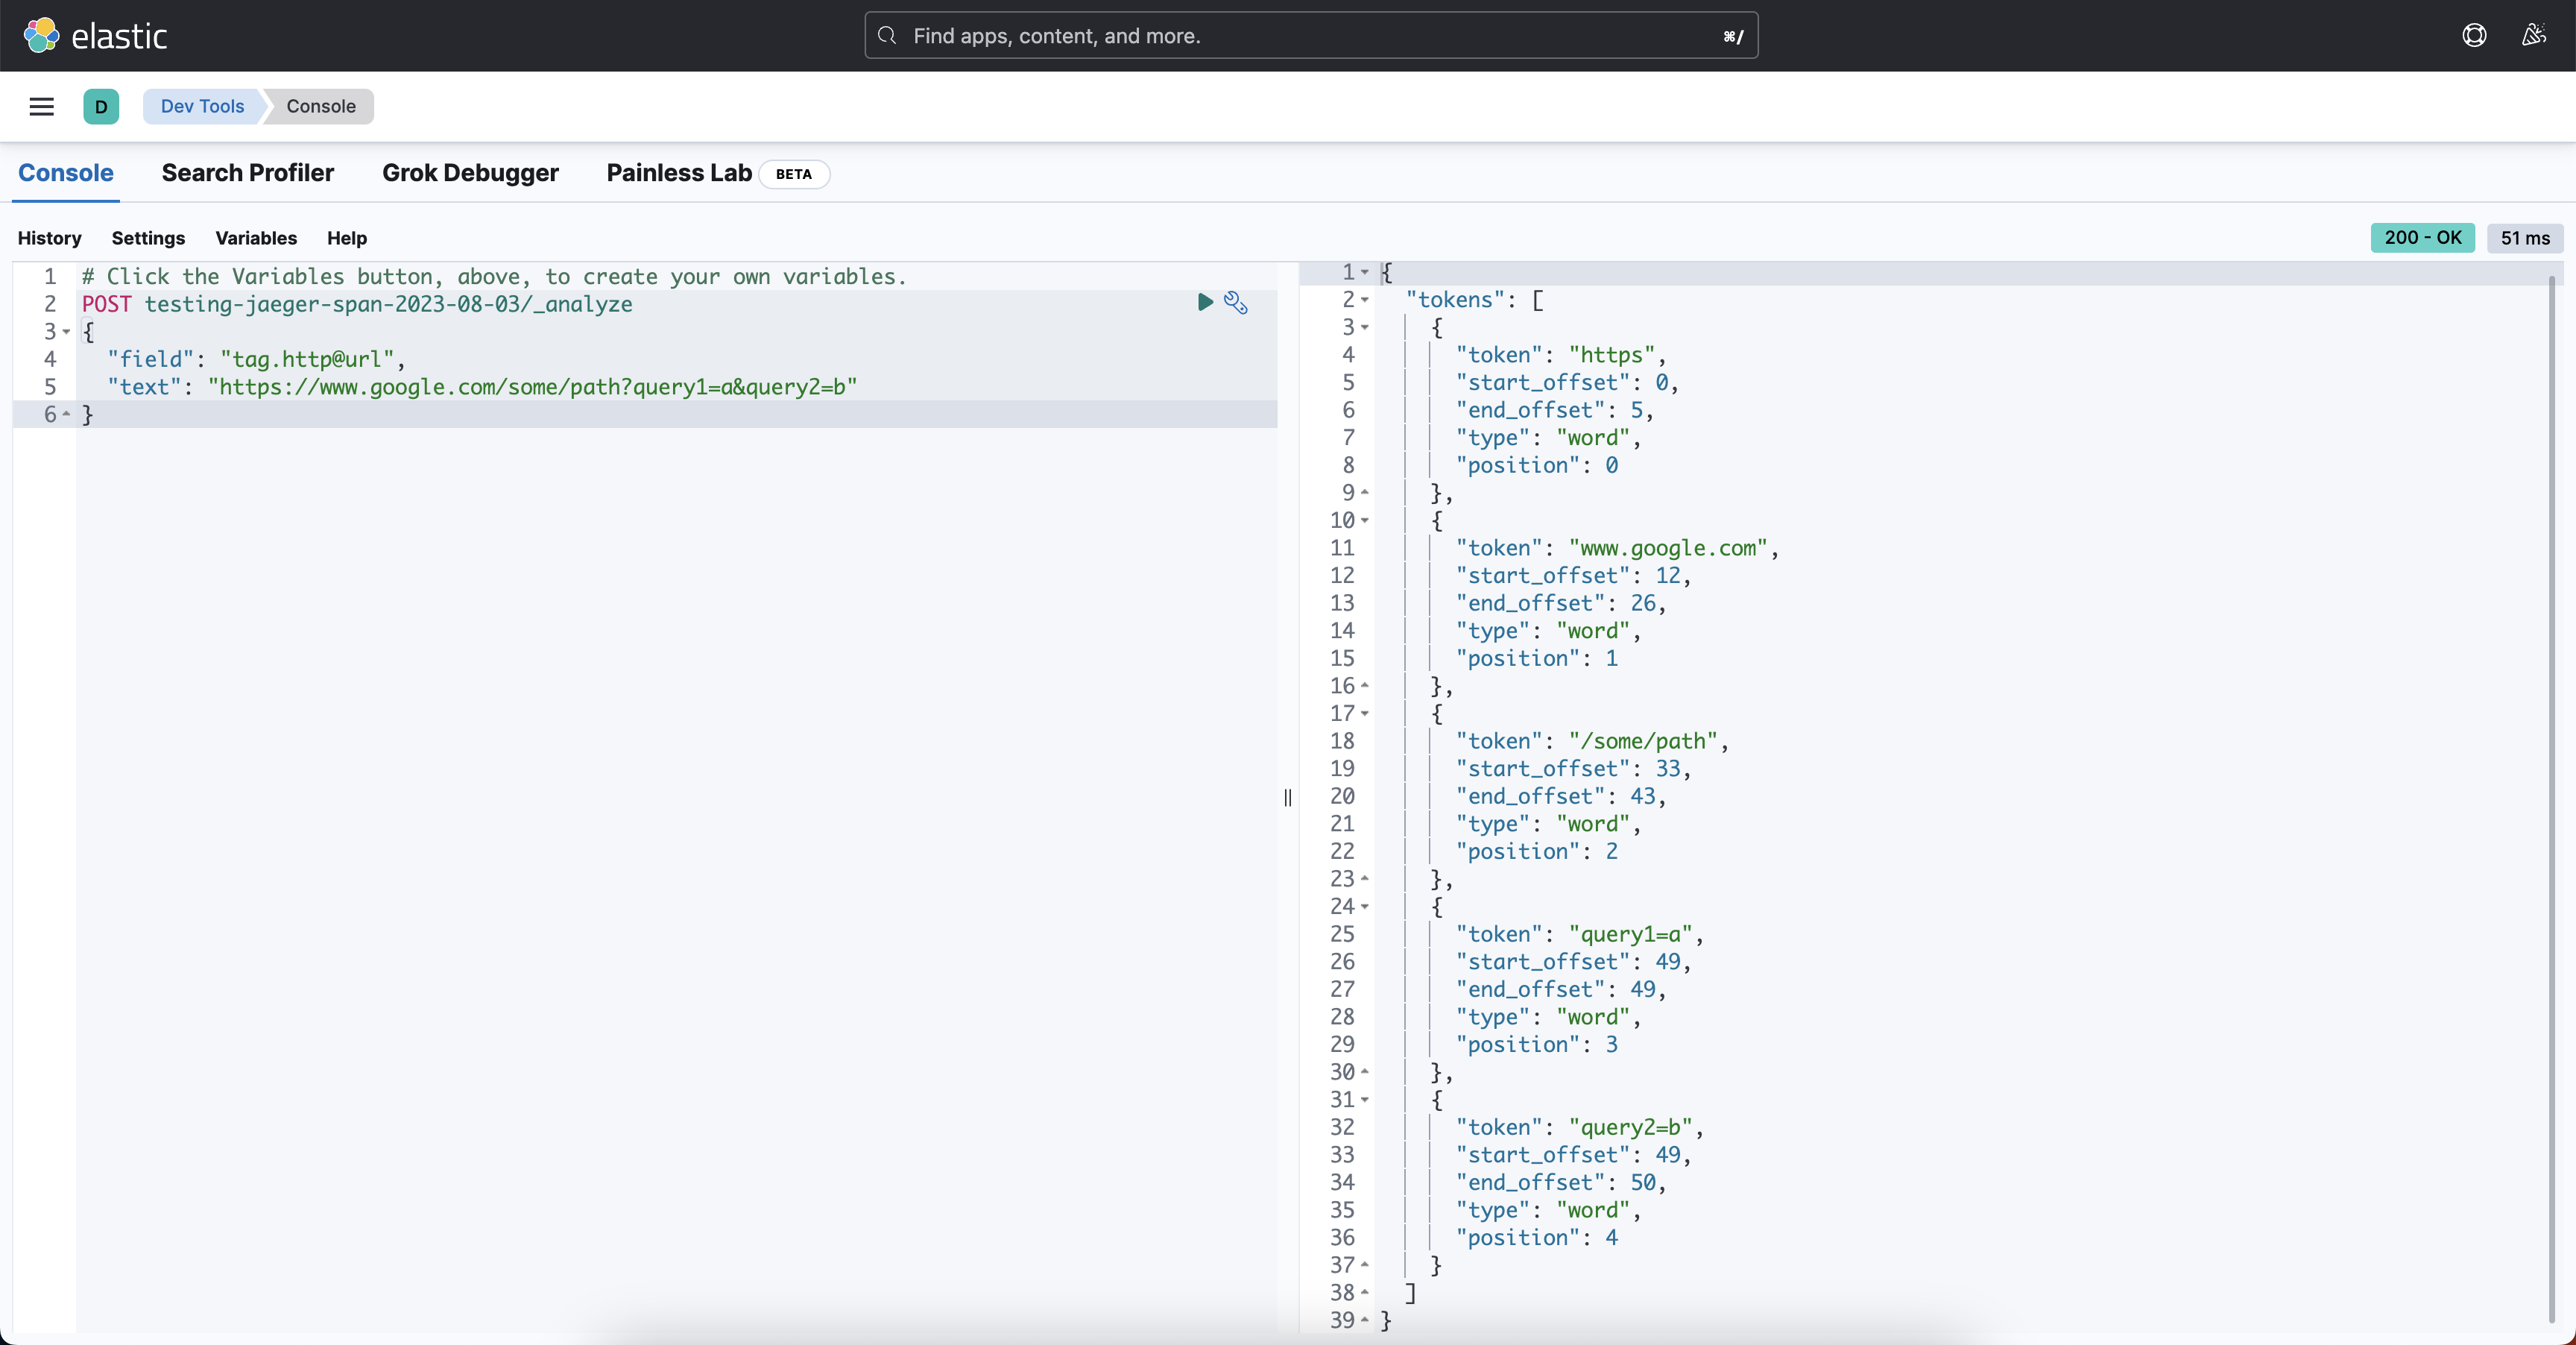
You can test it in the Kibana Dev Tools console by hitting the index/_analyze endpoint:

Great, we'd now be able to filter by tag.http@url: www.google.com, or tag.http@url: /some/path in a really performant way. Note how I've used eager_global_ordinals here too.
Index Settings
There are some other index settings you should really consider, they are:
index.refresh_interval: 60s. We're ingesting large amounts of data, refreshing the searchable index is very expensive. Set this to a value you're comfortable with, balancing how quickly results appear in Jaeger vs cluster load.index.codec: best_compression. To save on some storage costs at the expense of a small amount of CPU.settings.number_of_shards: X. You'll need to find the right balance for your load. General best practice is to not go above 50GB per shard. Ours sit around35GBwith anumber_of_shards: 30.
Query Caching
This might be controversial, but we set index.queries.cache.enabled: false on our prod-jaeger-span template. You can see here how we have over a 1GB on-heap query cache, with a measly 2% cache hit ratio. I'd rather that memory was free for the service to perform complex aggregations etc.

You should measure this yourself obviously, we use elasticsearch-exporter to get the metrics out. We found a few high-write indexes where this was the case.
Bonus Content!
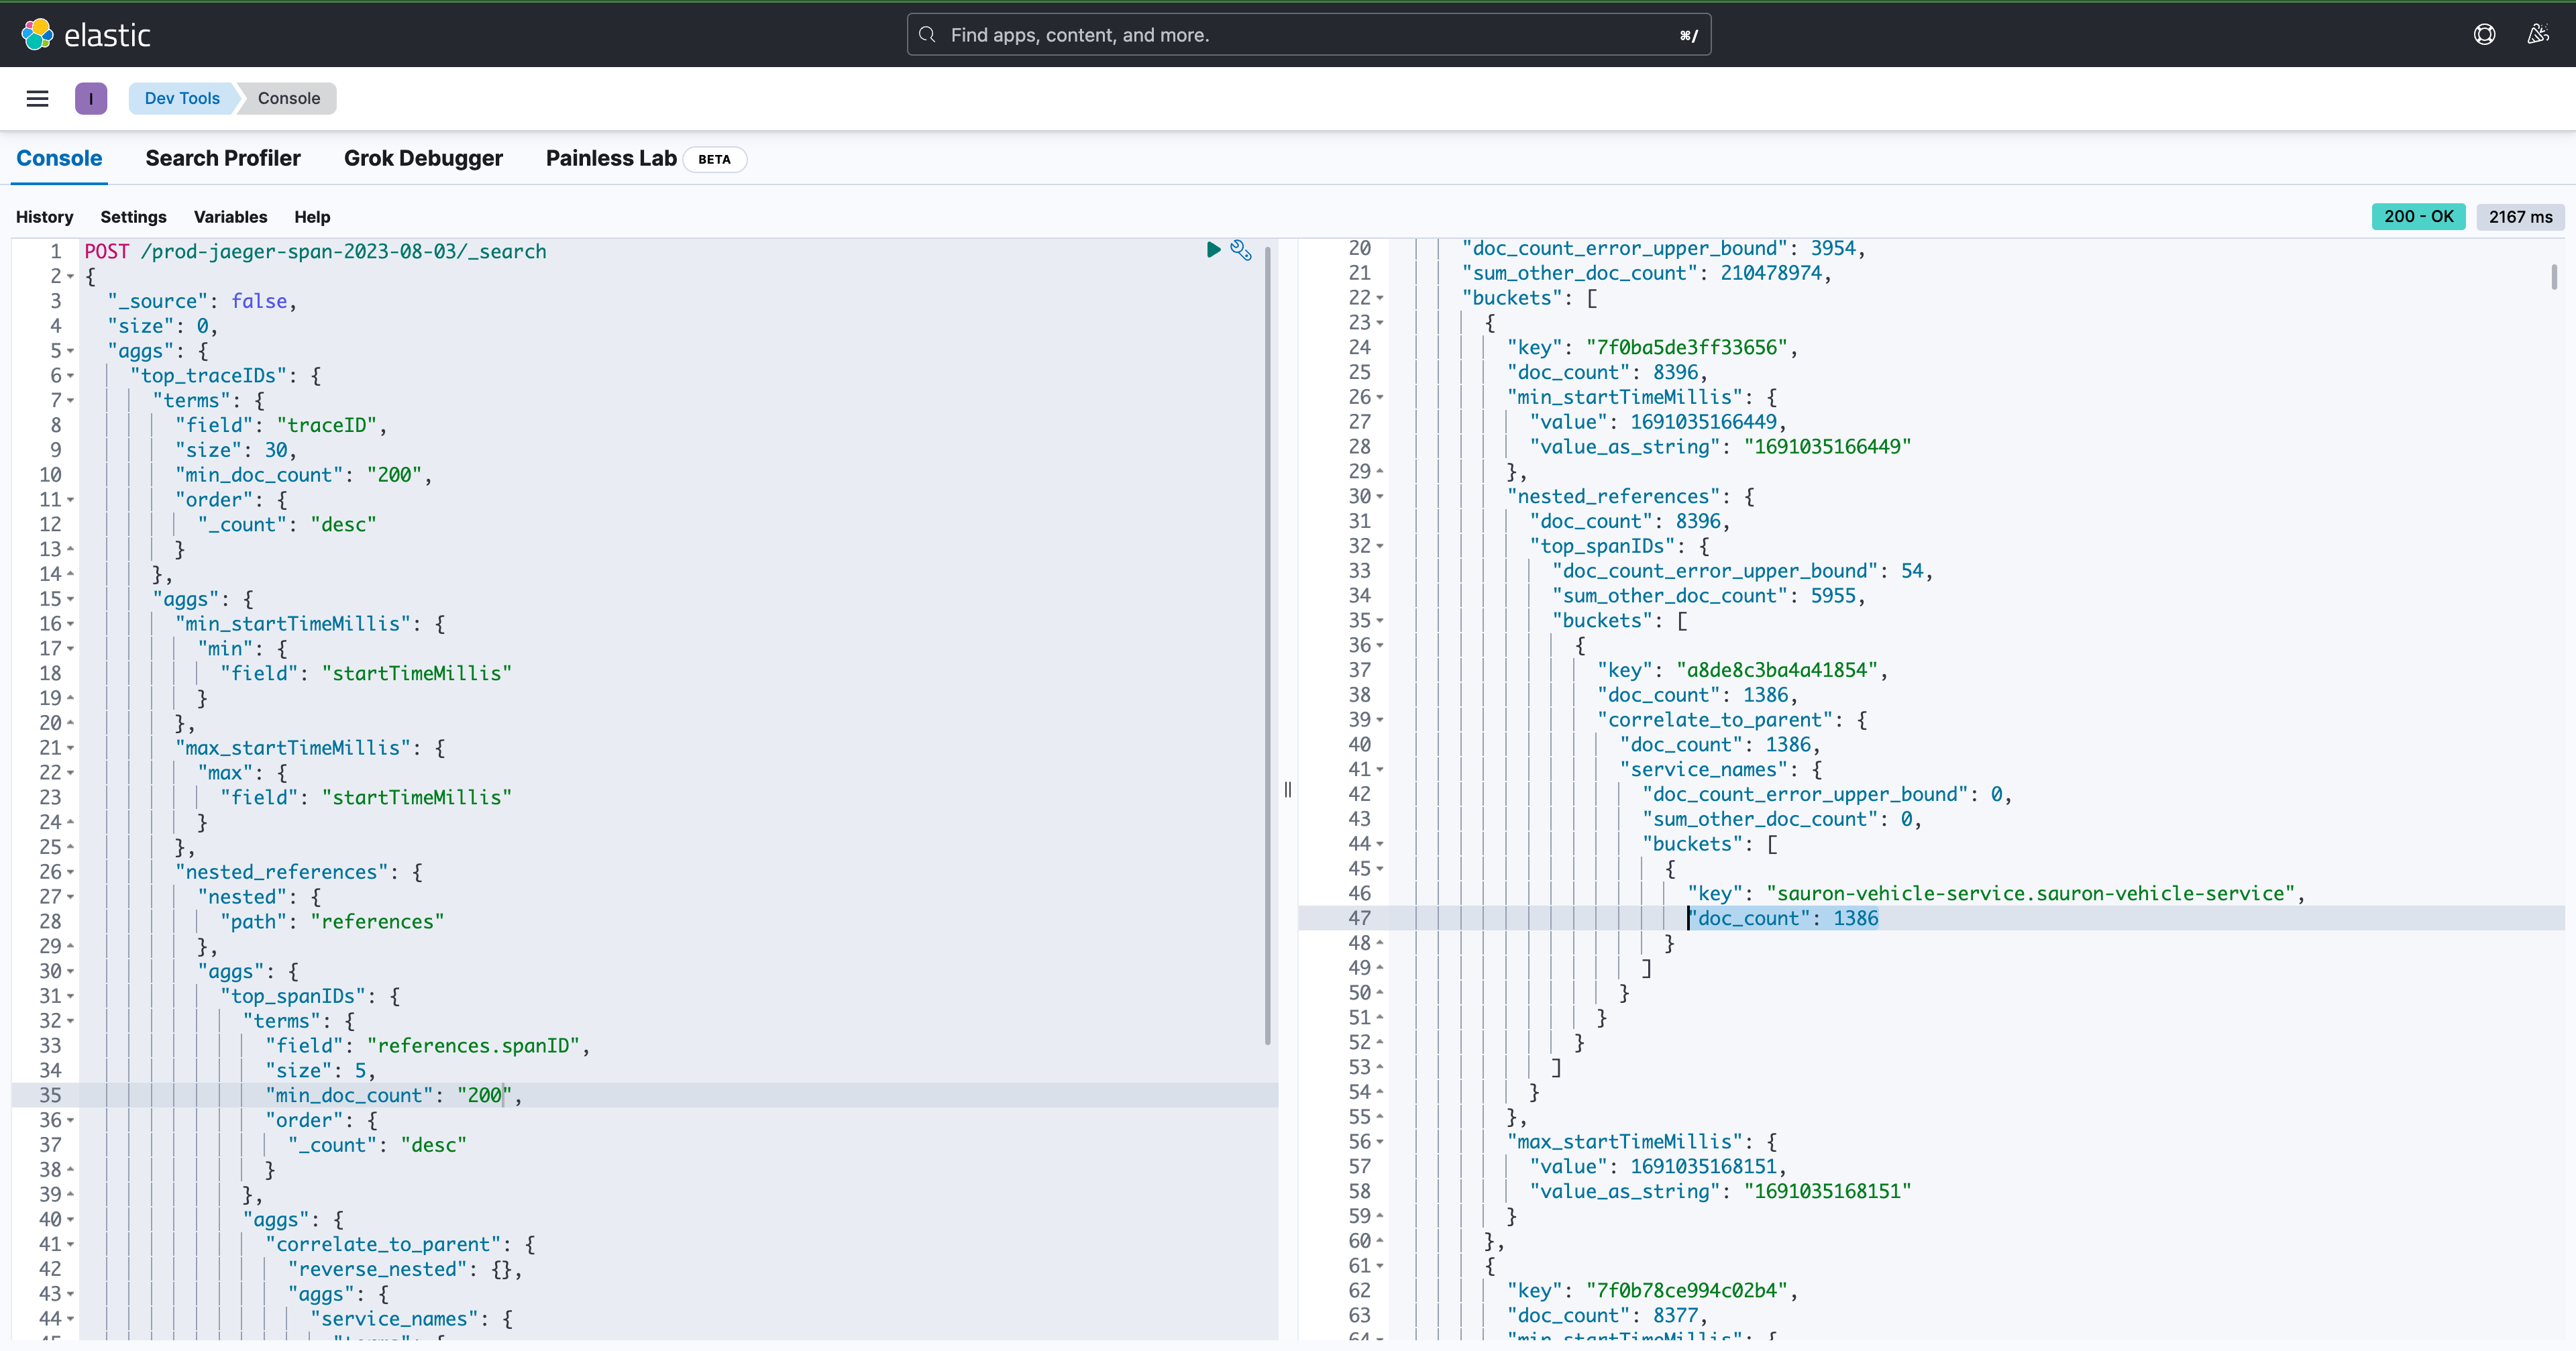
Now that you've tokenised your URLs, and created your ordinals up front, you can do some interesting aggregations on your data really quickly. The query below will find what we call "Request Amplification". Examples of services that fan out to many other services. For example, service-a might receive 1 request, but make 200 downstream calls. In some cases, we've spotted 1000's of downstream calls. You can use a query like this to highlight bugs or areas for optimisation (for example where a batch endpoint might be suitable).
{
  "_source": false,
  "size": 0,
  "aggs": {
    "min_startTimeMillis": {
      "min": {
        "field": "startTimeMillis"
      }
    },
    "max_startTimeMillis": {
      "max": {
        "field": "startTimeMillis"
      }
    },
    "nested_references": {
      "nested": {
        "path": "references"
      },
      "aggs": {
        "top_spanIDs": {
          "terms": {
            "field": "references.spanID",
            "size": 5,
            "min_doc_count": "2000",
            "order": {
              "_count": "desc"
            }
          },
          "aggs": {
            "correlate_to_parent": {
              "reverse_nested": {},
              "aggs": {
                "service_names": {
                  "terms": {
                    "field": "process.serviceName",
                    "size": 1
                  }
                },
                "trace_id": {
                  "terms": {
                    "field": "traceID",
                    "size": 1
                  }
                }
              }
            }
          }
        }
      }
    }
  }
}
Check it out, here we can see that in span 1e87ccaffd1d27cb sales-insight-admin.sales-insight-admin received one request but made 3,236 calls, ouch!

Summary
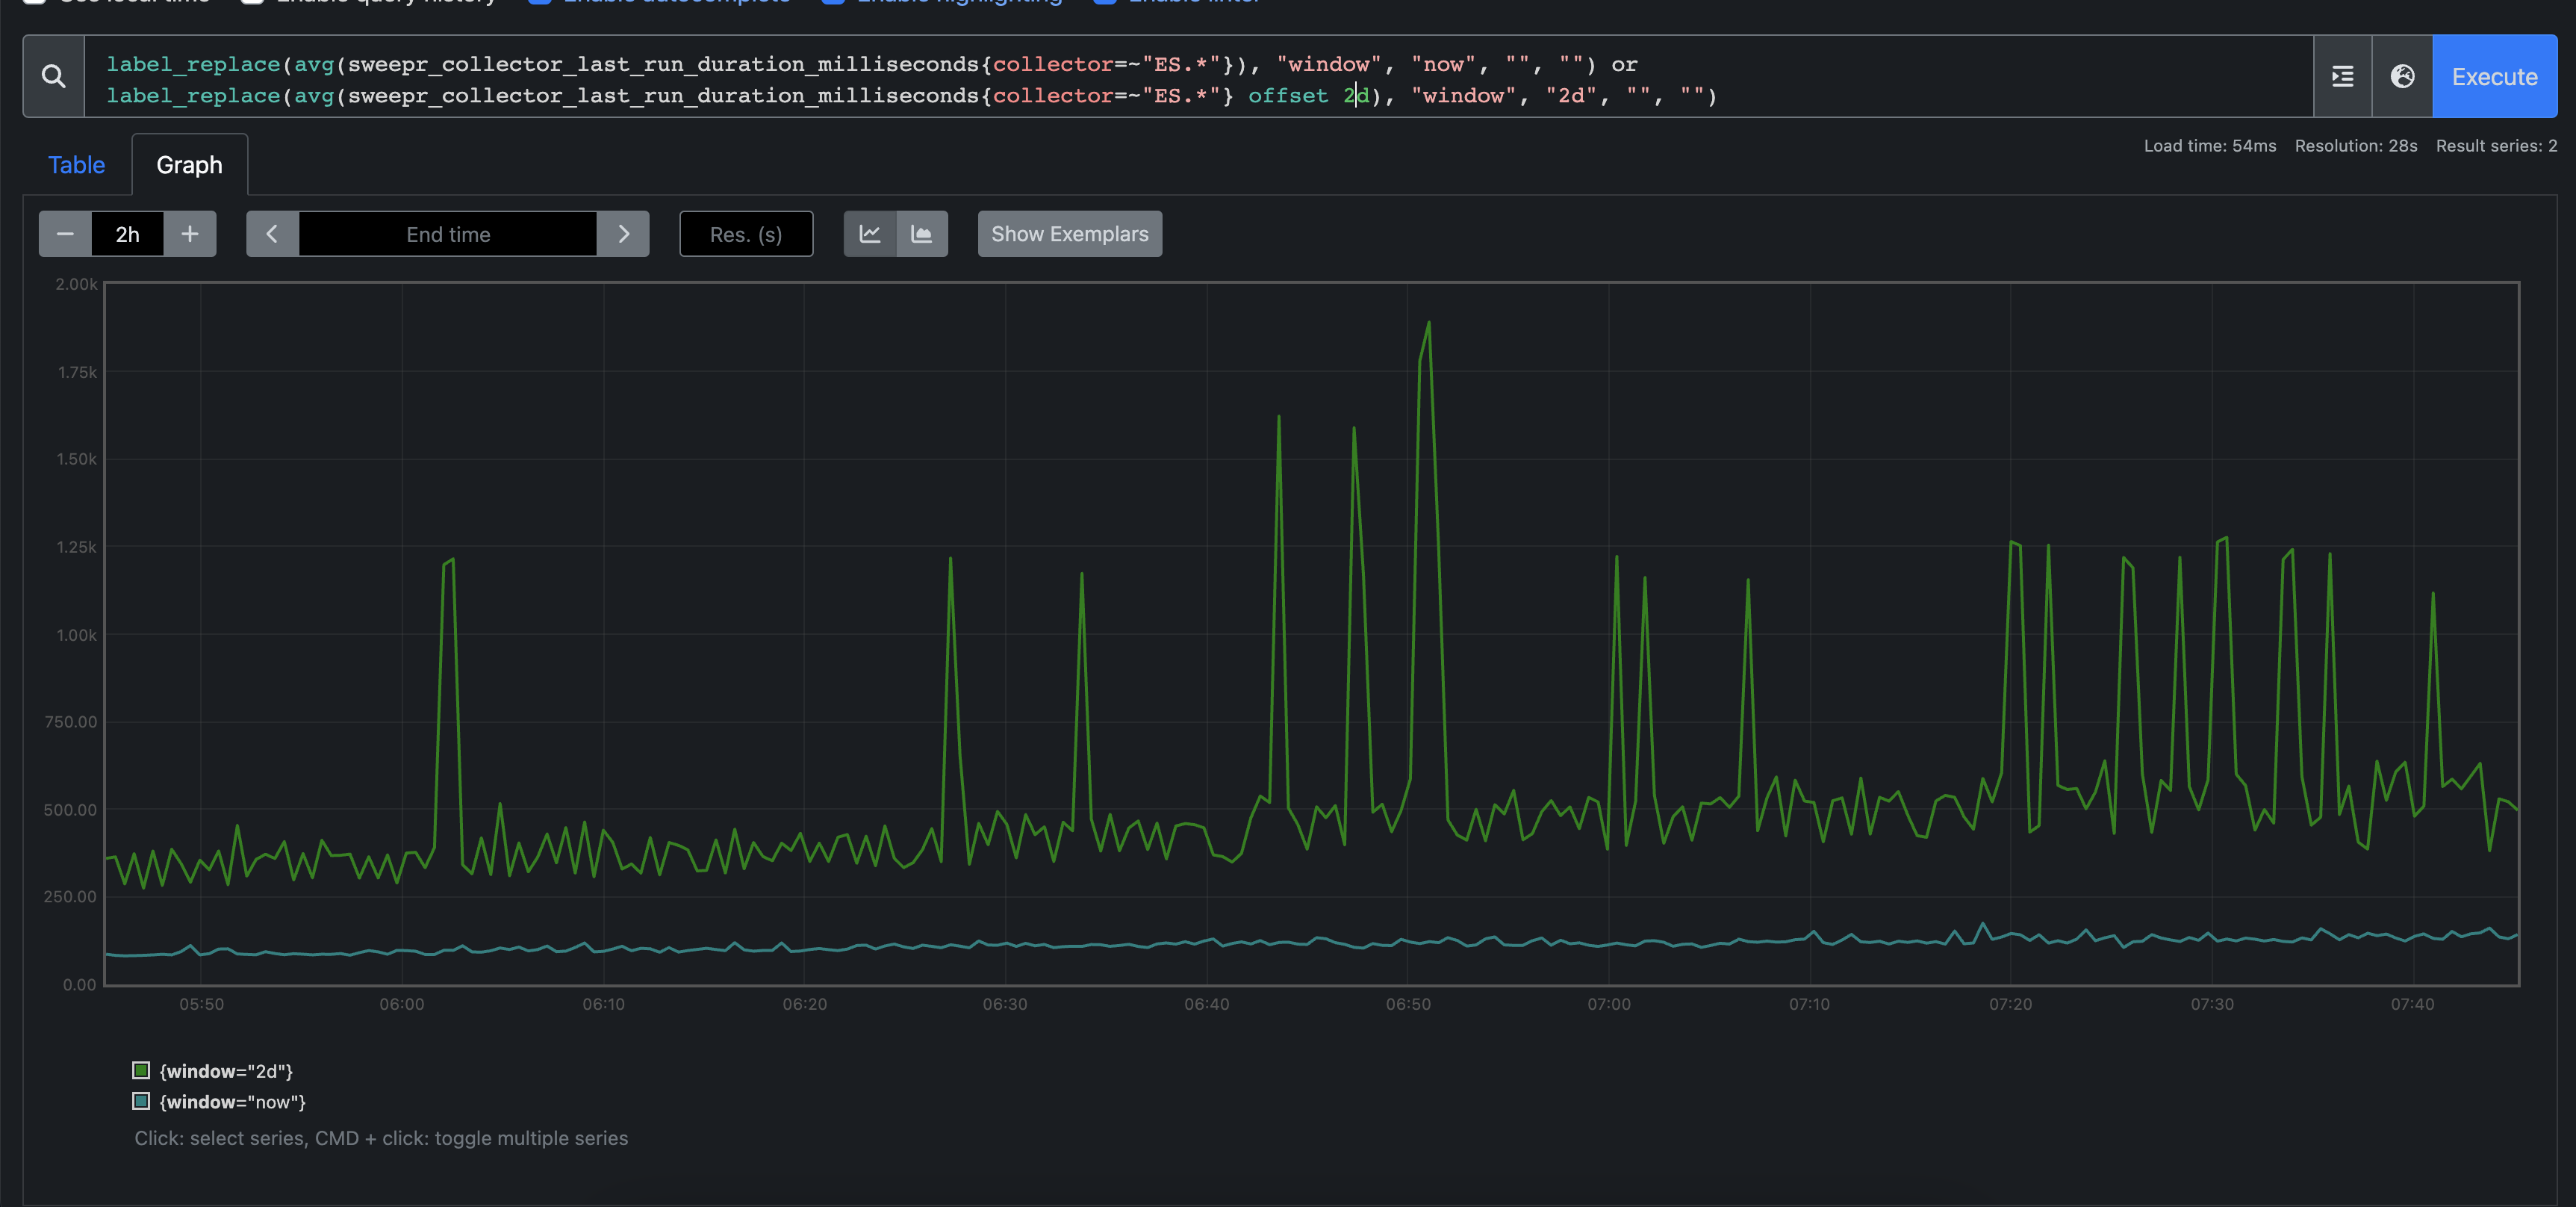
Implementing these changes made significant improvements in the search performance of Jaeger data for us. You can see here the before and after average response time of some scheduling scraping we do against the index:

I've put our whole index template on a gist here.
