Anomaly Alerting in Prometheus
Exploring how to do anomaly alerting on seasonal data in Prometheus.

At Auto Trader, we strive to build alerts that the majority can benefit from out-of-the-box, rather than hard coded alerts for specific scenarios. We want you to be able to deploy a service and just get value from the platform - particularly when it comes to observing and alerting on your Golden Signals, or Managing your Costs.
We've done a pretty good job of this when thinking about obvious threshold based alerts (for example; CPU usage > CPU request for 15 minutes or more), but we strived to improve alerting on anomalies too, to help us detect things like regressions in performance, without defining explicit thresholds.
In this post I'll be looking at how to use Prometheus with Istio, to do anomaly detection on the response time of your operational services. The implementation will be generic enough that we can apply it globally to all services running on your mesh. You'll be able to apply the same pattern to pretty much any rate-metric you care about.
Recording our Baseline
We are going to be looking at istio_request_duration_milliseconds_bucket, which is a Histogram. It also has a lot of dimensions which makes it a very high cardinality metric to work with. The first thing we want to do is roll it up into a simple time series we can work with, using a Recording Rule.
- record: "recorded:istio_request_duration_milliseconds_bucket:p95"
  expr: |
    histogram_quantile(
      0.95,
      sum by (destination_workload, le) (
        irate(istio_request_duration_milliseconds_bucket[1m])
      )
    )
This will give us a nice line for each destination_workload on our cluster. Now in our case, we have 1 workload per namespace. Your setup may be different, in which case you'll need to add destination_workload_namespace too. Or you could use destination_service, if you prefer to group by the FQDN. That's up to you.
In this example I've also opt'd to only focus on the P95 response time, but again that's another decision you'll have to make on what's right for your system.
Building a Prediction
The next thing we need to do when we're trying to detect an anomaly, is have a prediction of where we believe the response time should be. The most basic of predictions would be some time based offset from where you are now, say for example; the same time yesterday (if you have a daily trend), or the same time a week ago (if you have a weekly trend).
At Auto Trader, our patterns are pretty typical when you look at a daily and weekly sample. So we could start by looking at the same time window in the previous week. However we don't want a single outlier week to skew our prediction, so instead - we'll take an average of the last 3 weeks. Unfortunately this is where you'll need to be a bit patient, you'll need to wait until you've got 3 weeks of data recorded using your rule for recorded:istio_request_duration_milliseconds_bucket:p95. Or, you could have a stab at backfilling, which ill go into at the end.
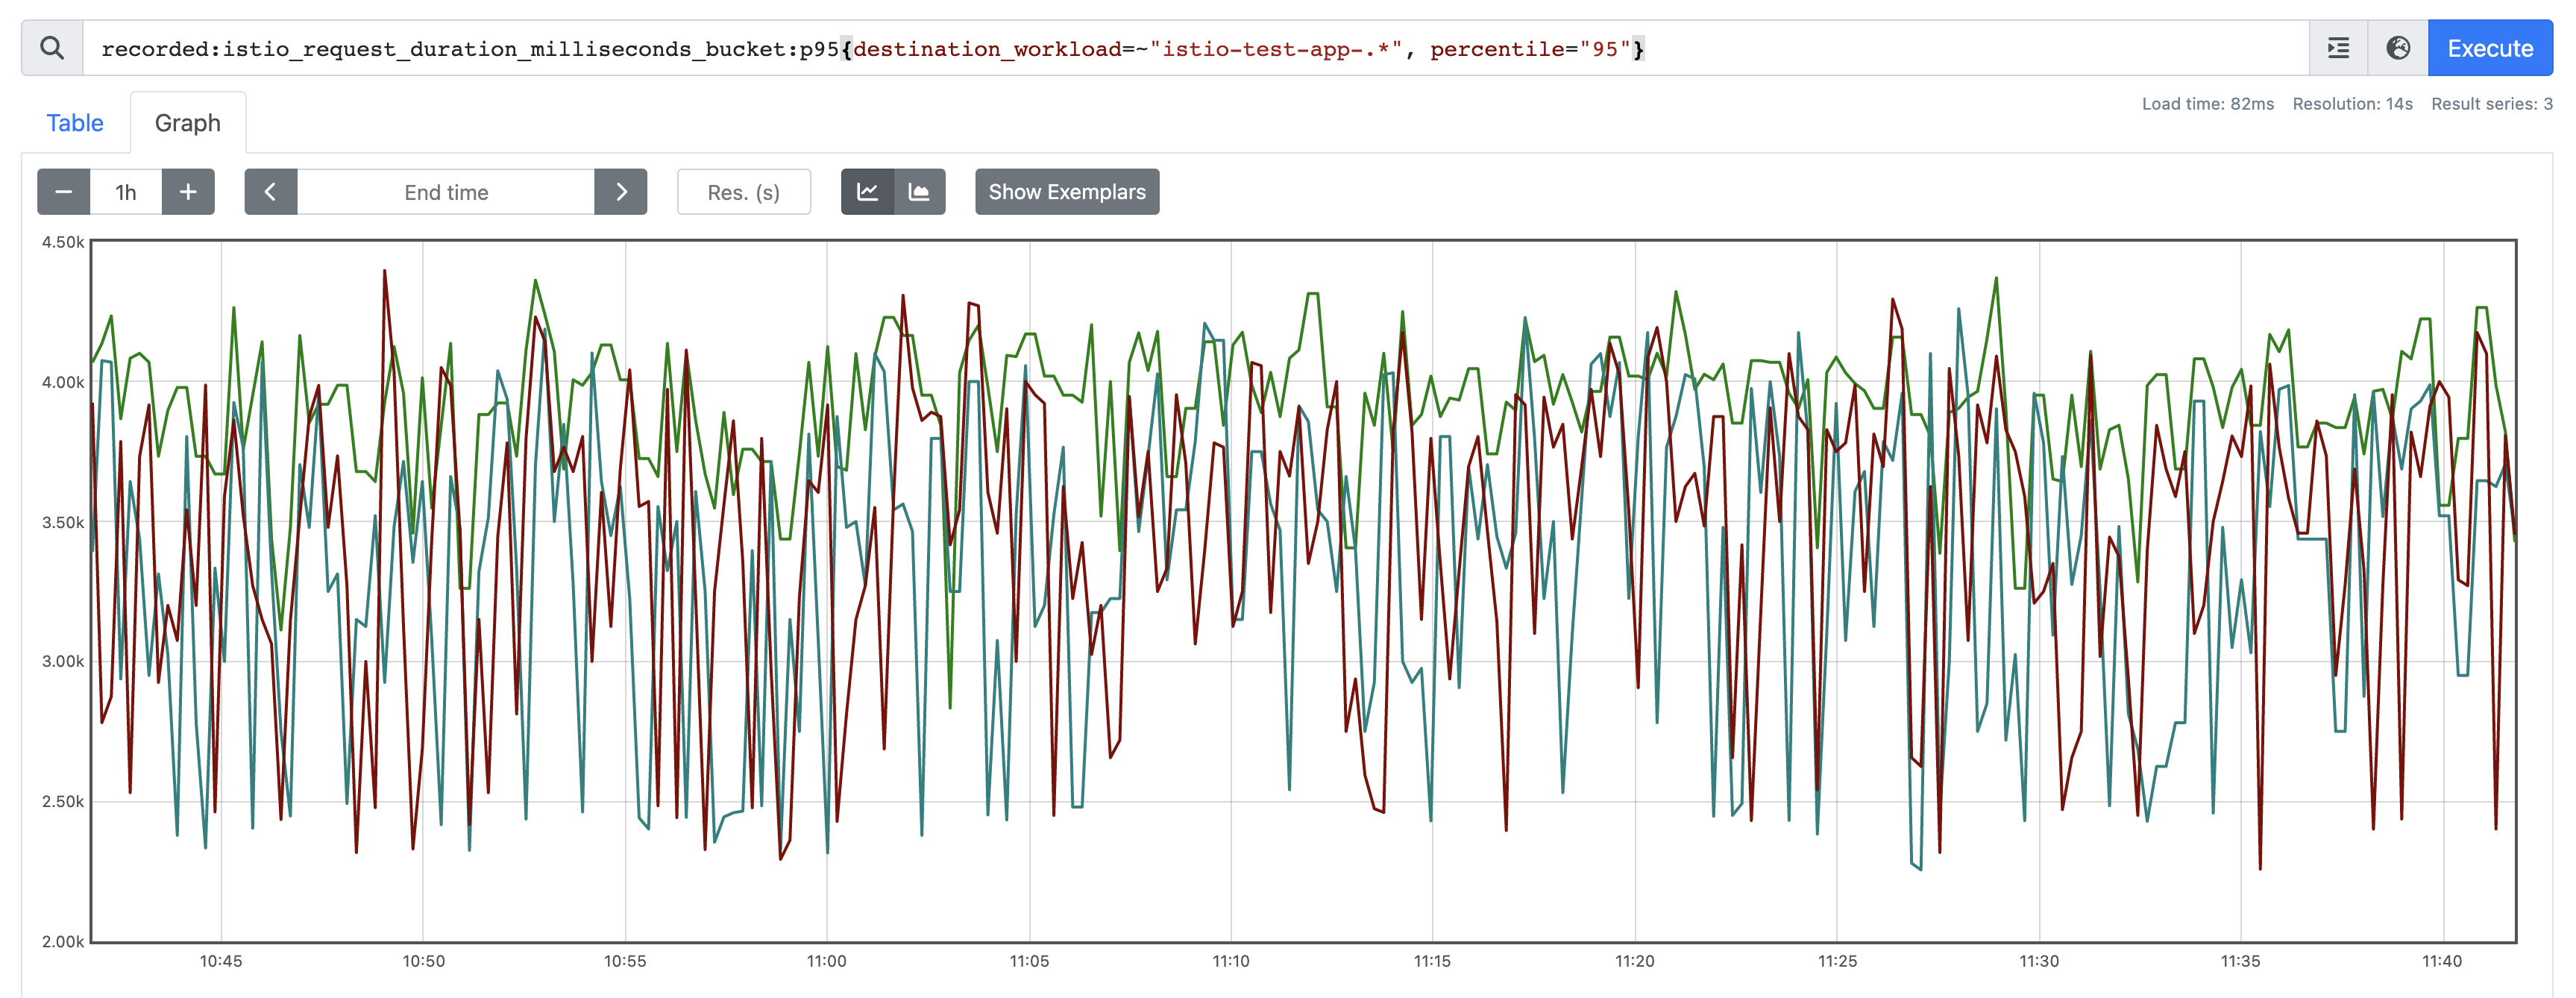
Once you've got that in place though, have a quick look at your data over the past few weeks. I'm targetting a single service here for demo purposes, as it has a known spike at a particular time of day:
There are a few other things to consider here. We want a relatively smooth prediction. So we can smooth out the signal using an avg_over_time as a windowing function. In order to ensure our average reprsesnts the correct time window, we need to ensure we offset - half that average. So for example here i've decided to average at 5m, so instead of offsetting 1w, I do 6d23h57m30s, so 2.5m either side.
avg_over_time(
  istio_request_duration_milliseconds_bucket:destination:rate1m[5m] offset 6d23h57m30s
)
But we should also consider growth/decline when we're looking back. Remember we're trying to create a prediction of where things should be now, not weeks ago. So we can do that by calculating the growth (the average for this week, minus the average for the week we're sampling):
avg_over_time(
  istio_request_duration_milliseconds_bucket:destination:rate1m[5m] offset 6d23h57m30s
)
+
(
  avg_over_time(
    istio_request_duration_milliseconds_bucket:destination:rate1m[5m]
  )
  -
  avg_over_time(
    istio_request_duration_milliseconds_bucket:destination:rate1m[5m] offset 1w
  )
)
Great. So if you apply the same pattern to each of our look back windows, you'll end up with a recording rule that looks something like this. Notice we use the quantile(0.5 function to find the median across our weekly samples.
- record: anomaly:istio_request_duration_milliseconds_bucket:p95:prediction
  expr: |
    quantile(0.5,
      label_replace(
        (
          avg_over_time(recorded:istio_request_duration_milliseconds_bucket:p95[5m] offset 6d23h57m30s)
          +
          (avg_over_time(recorded:istio_request_duration_milliseconds_bucket:p95[1w]) - avg_over_time(recorded:istio_request_duration_milliseconds_bucket:p95[1w] offset 1w))
        ), "offset", "1w", "", ""
      )
      or
      label_replace(
        (
          avg_over_time(recorded:istio_request_duration_milliseconds_bucket:p95[5m] offset 13d23h57m30s)
          +
          (avg_over_time(recorded:istio_request_duration_milliseconds_bucket:p95[1w]) - avg_over_time(recorded:istio_request_duration_milliseconds_bucket:p95[1w] offset 1w))
        ), "offset", "2w", "", ""
      )
      or
      label_replace(
        (
          avg_over_time(recorded:istio_request_duration_milliseconds_bucket:p95[5m] offset 20d23h57m30s)
          +
          (avg_over_time(recorded:istio_request_duration_milliseconds_bucket:p95[1w]) - avg_over_time(recorded:istio_request_duration_milliseconds_bucket:p95[1w] offset 1w))
        ), "offset", "3w", "", ""
      )
    ) without(offset)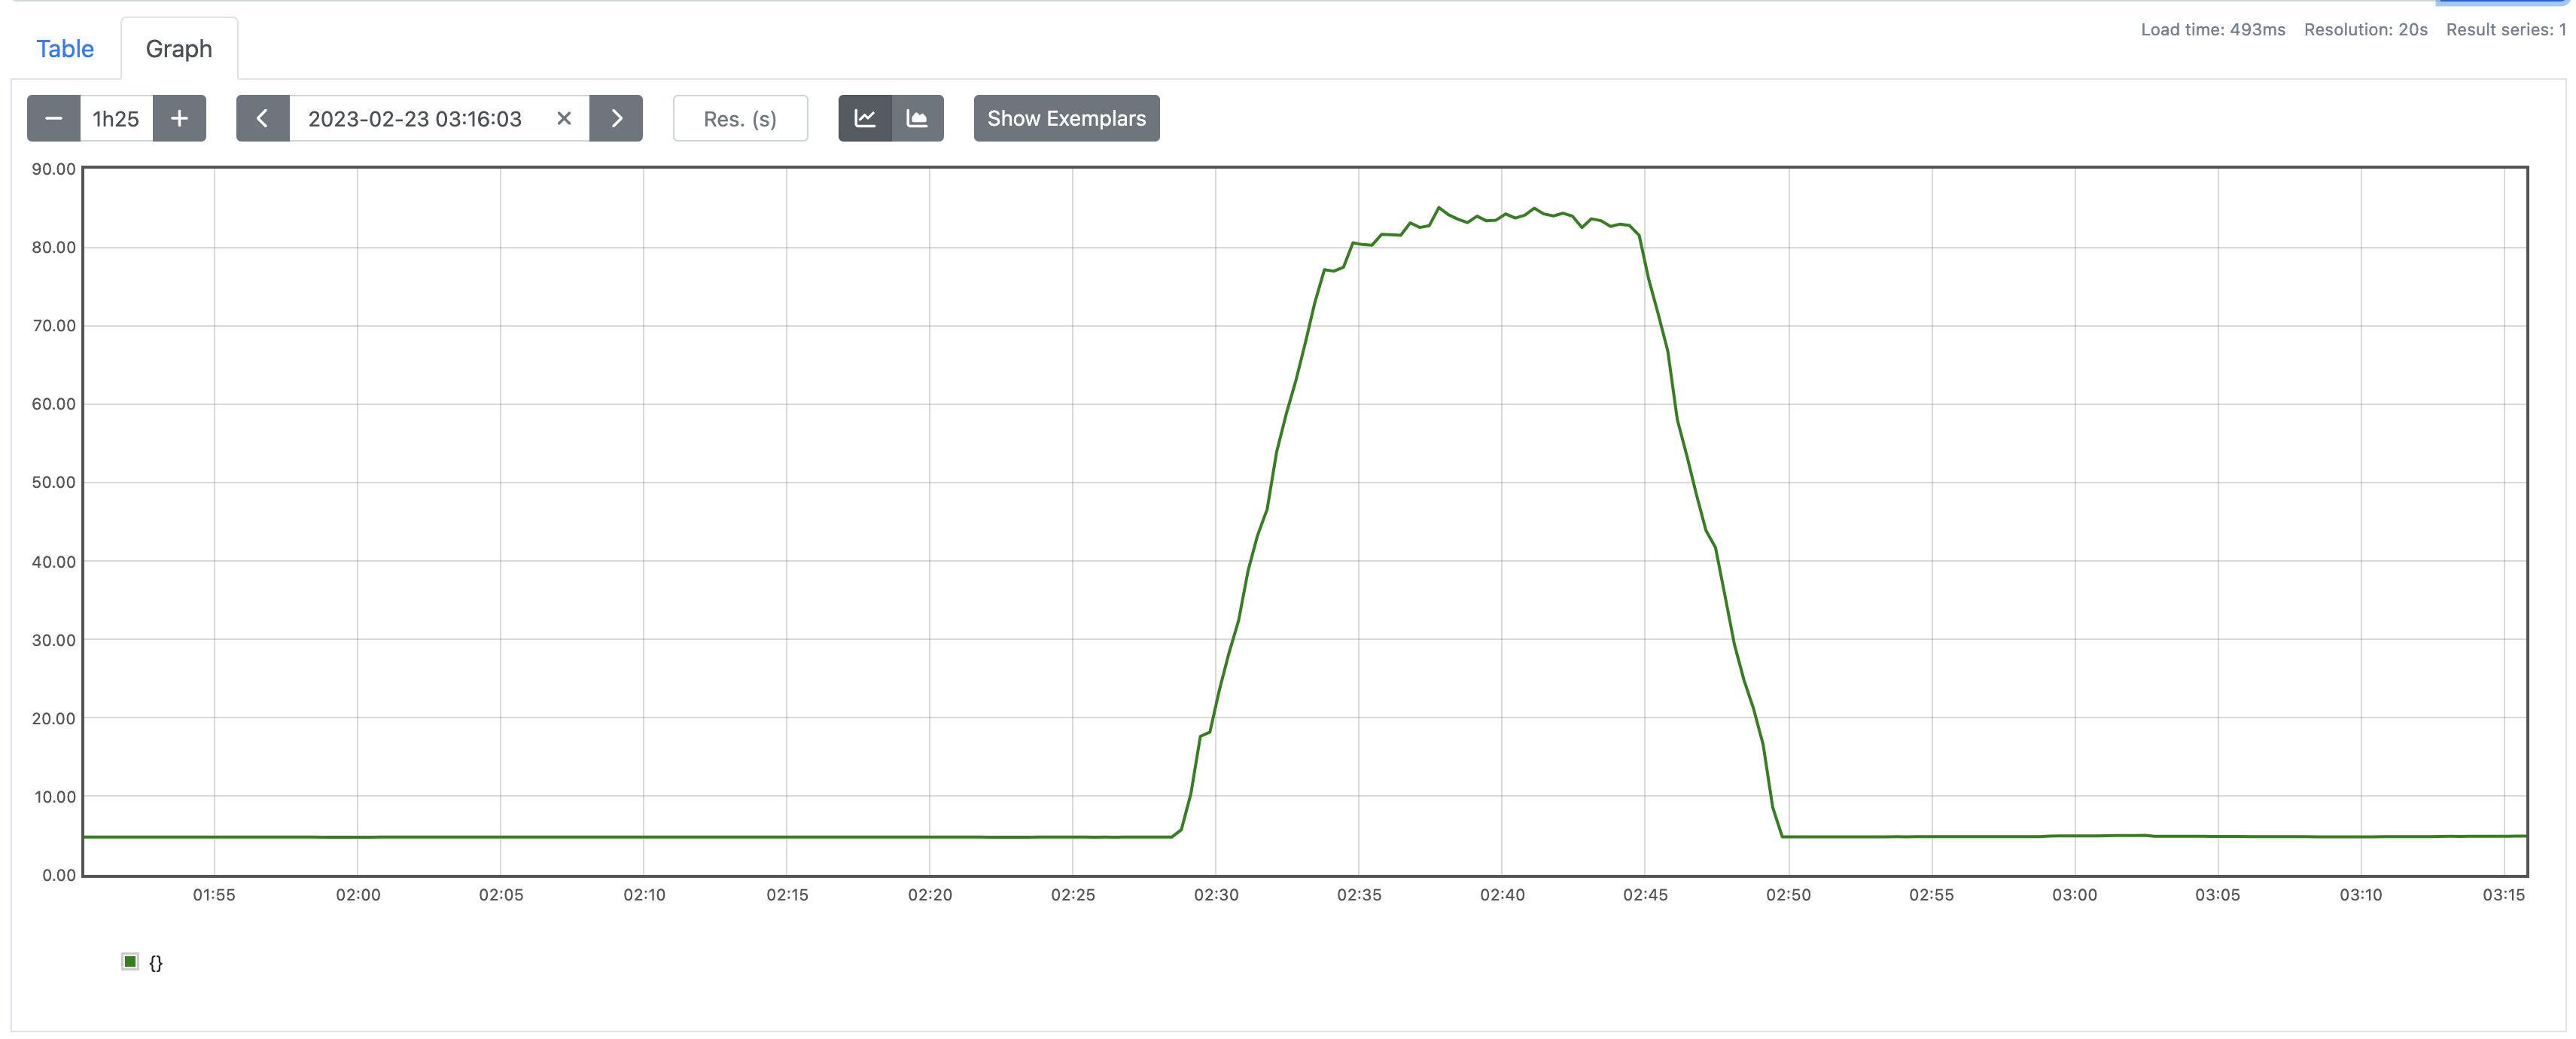
Calculating the Z-Score
So we have our prediction, the next thing we want do is create a signal line we can alert on. A z-score (also called a standard score) gives you an idea of how far from the mean (in standard deviations) a data point is. Typically anything more than say, 3 standard deviations from the mean could be considered an anomaly.
The formula to calculate this is pretty simple: (current value - predicted value) / standard deviation of the value from the past week). Again, we'll be using another recording rule in order to capture this:
- record: anomaly:istio_request_duration_milliseconds_bucket:p95:zscore
  expr: |
    (
      (
        avg_over_time(recorded:istio_request_duration_milliseconds_bucket:p95[5m])
        -
        avg_over_time(anomaly:istio_request_duration_milliseconds_bucket:p95:prediction[5m])
      )
      / stddev_over_time(recorded:istio_request_duration_milliseconds_bucket:p95[1w])
    )
So lets take a look at what that looks like across all of our services:
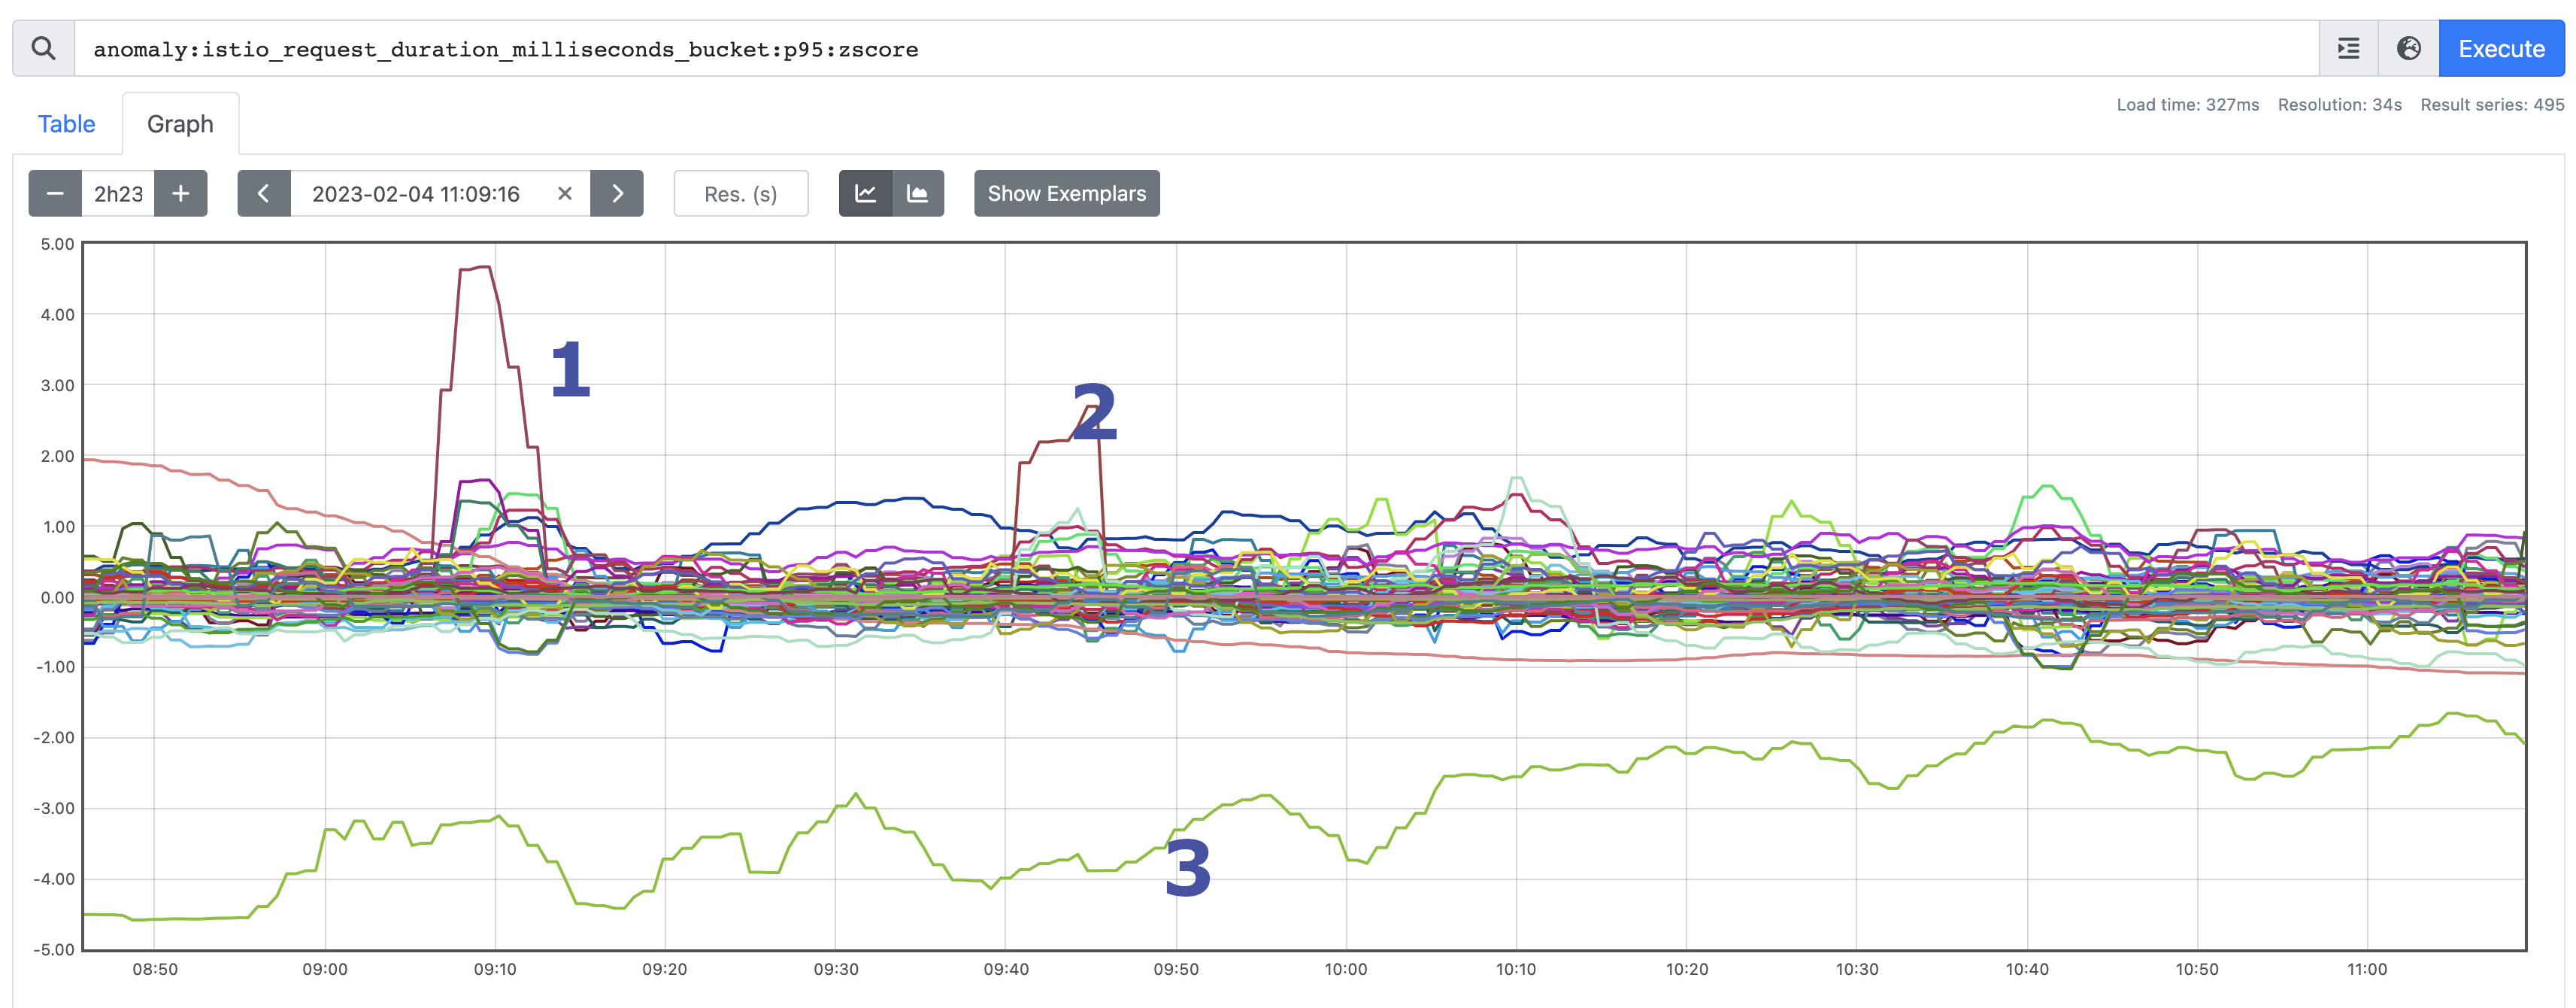
As you can see, the vast majority are sat +/- 1 standard deviations from the prediction, but there are certainly some outliers. Let's take a look at what they highlight.
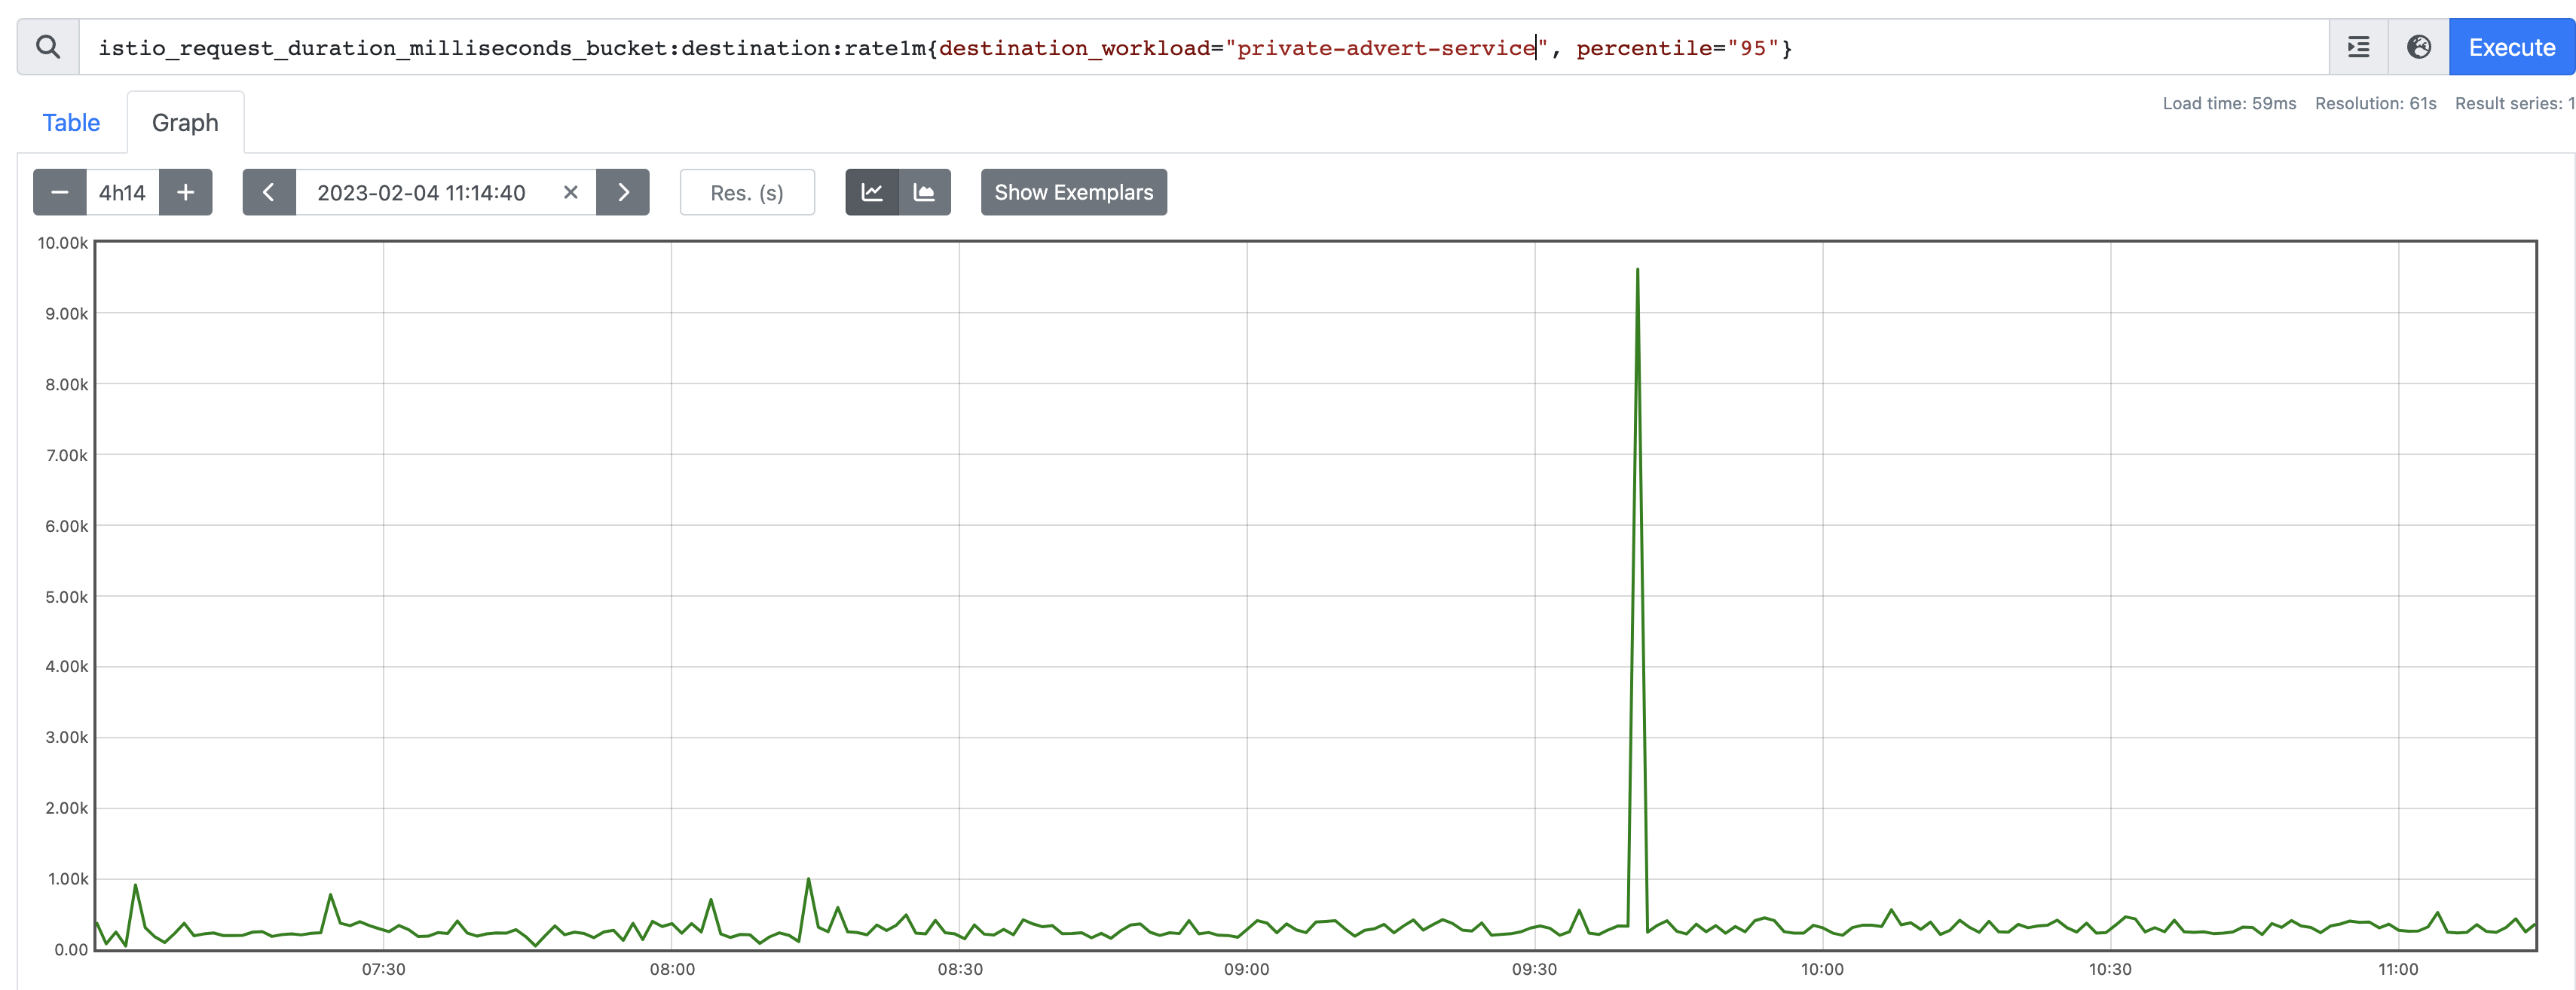
Outlier #1

Looks like a valid outlier; we certainly had a latency spike.
Outlier #2
Also looks pretty legit. Certainly had a spike.
Outlier #3
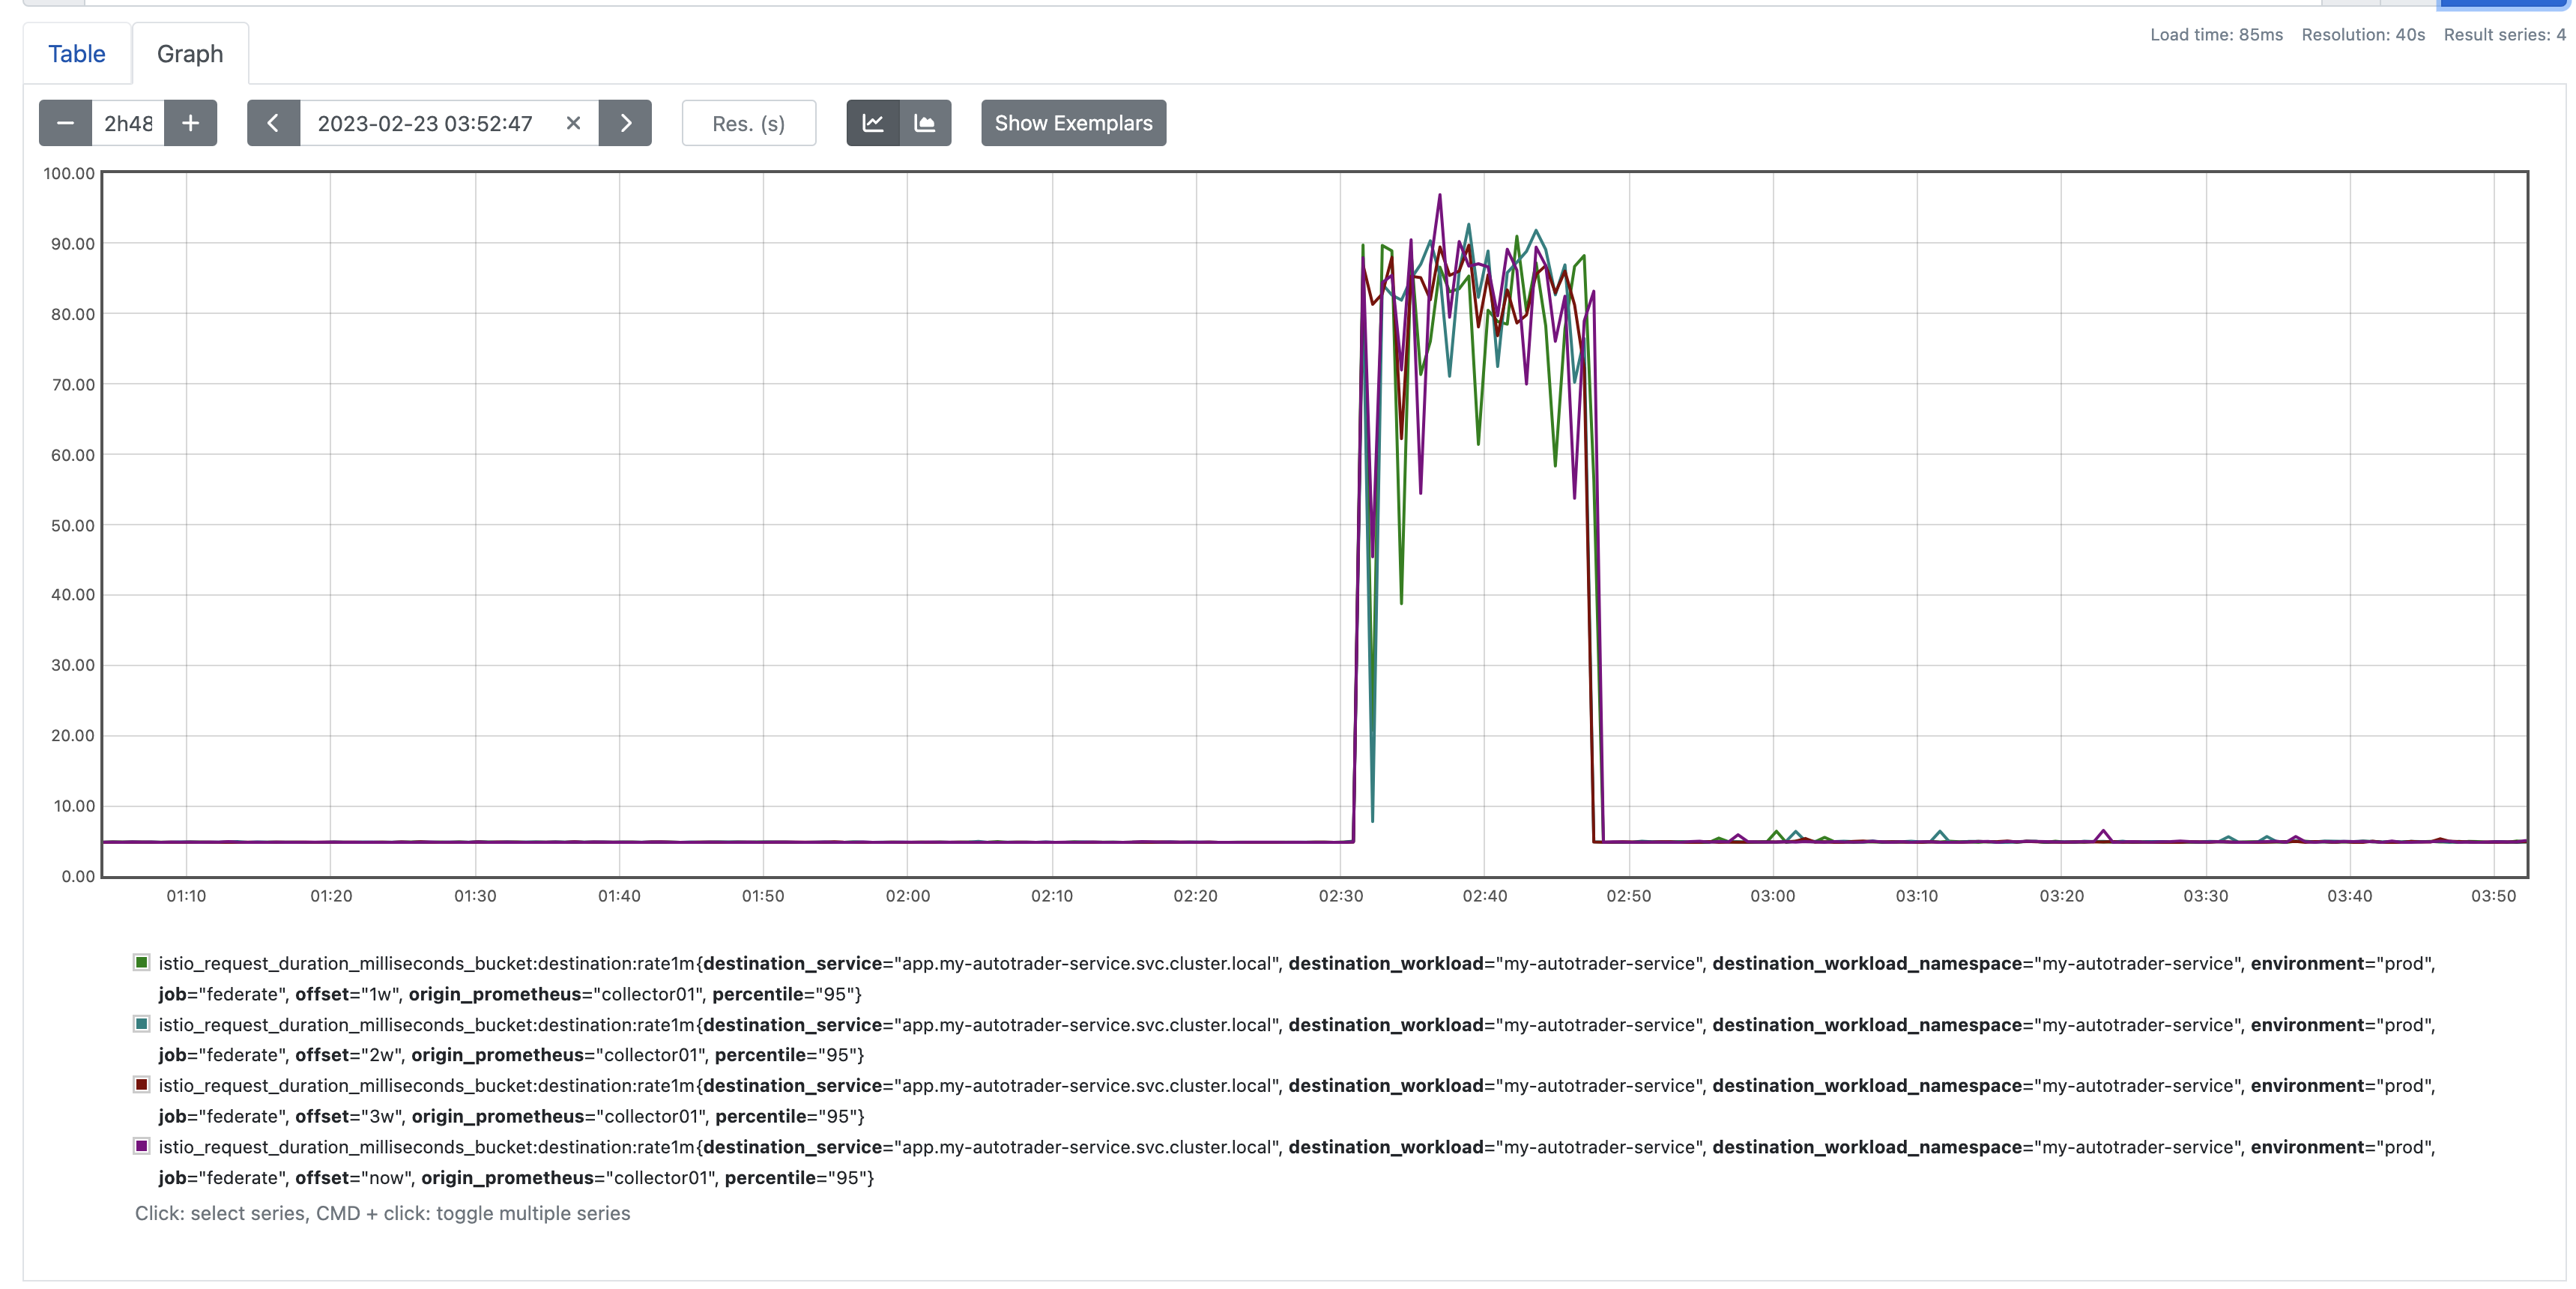
This one is certainly more interesting as it's recording a z-score pretty consistently of around -3:
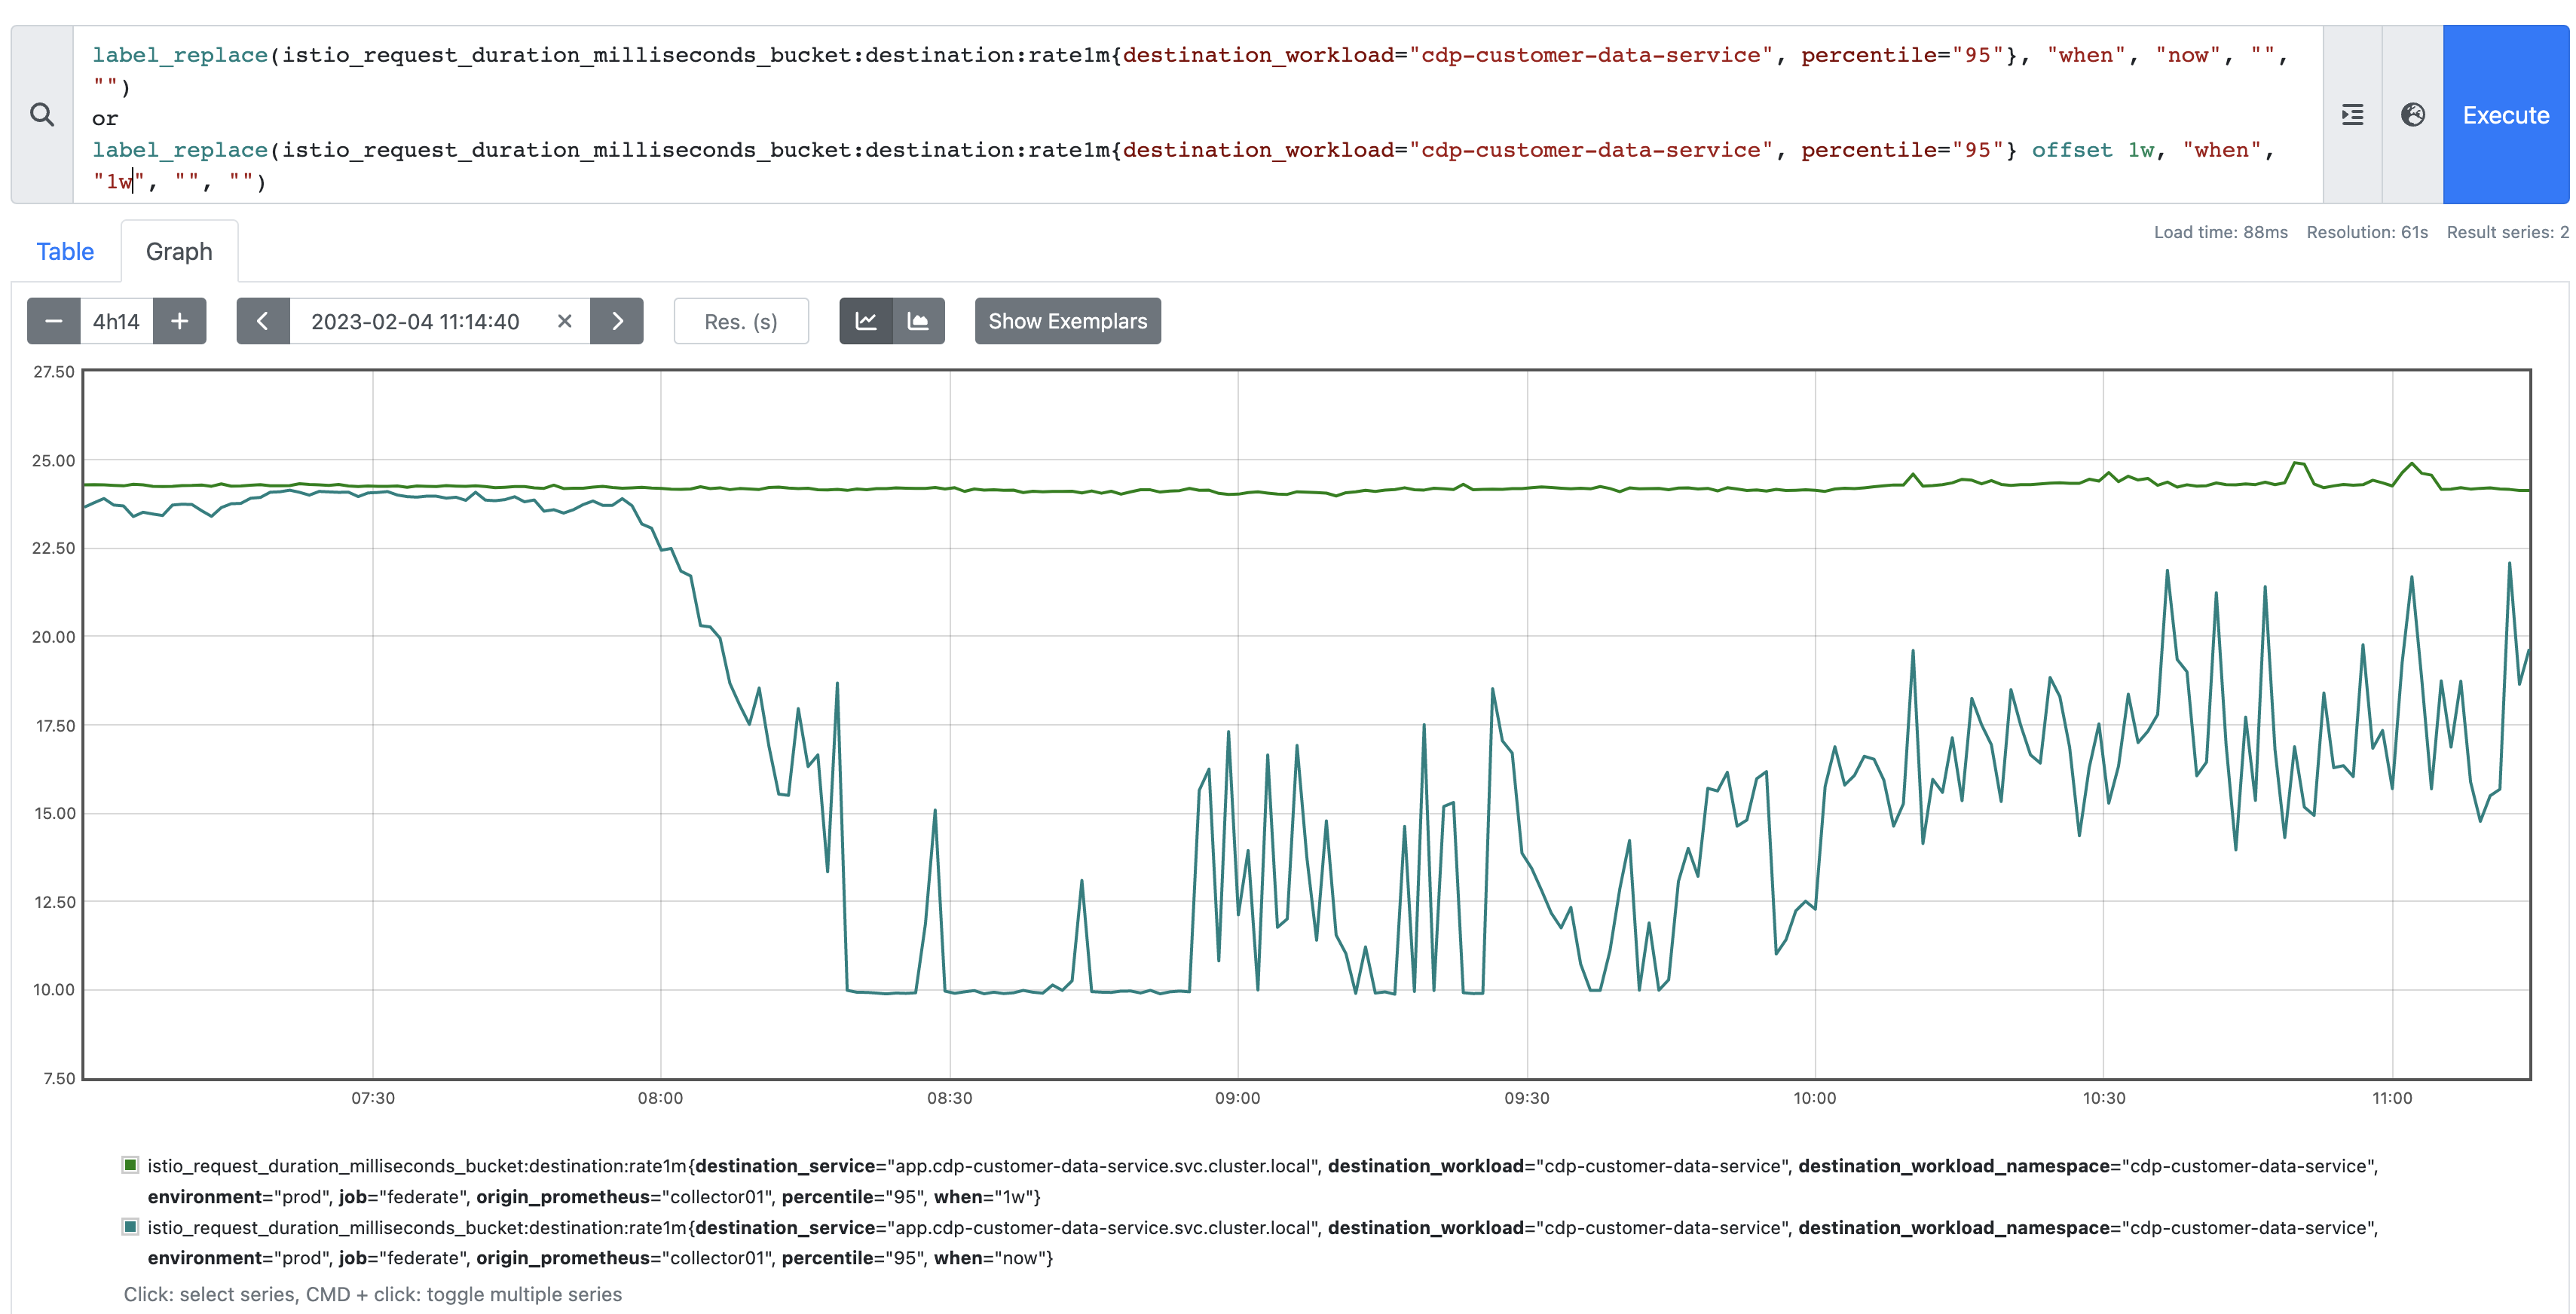
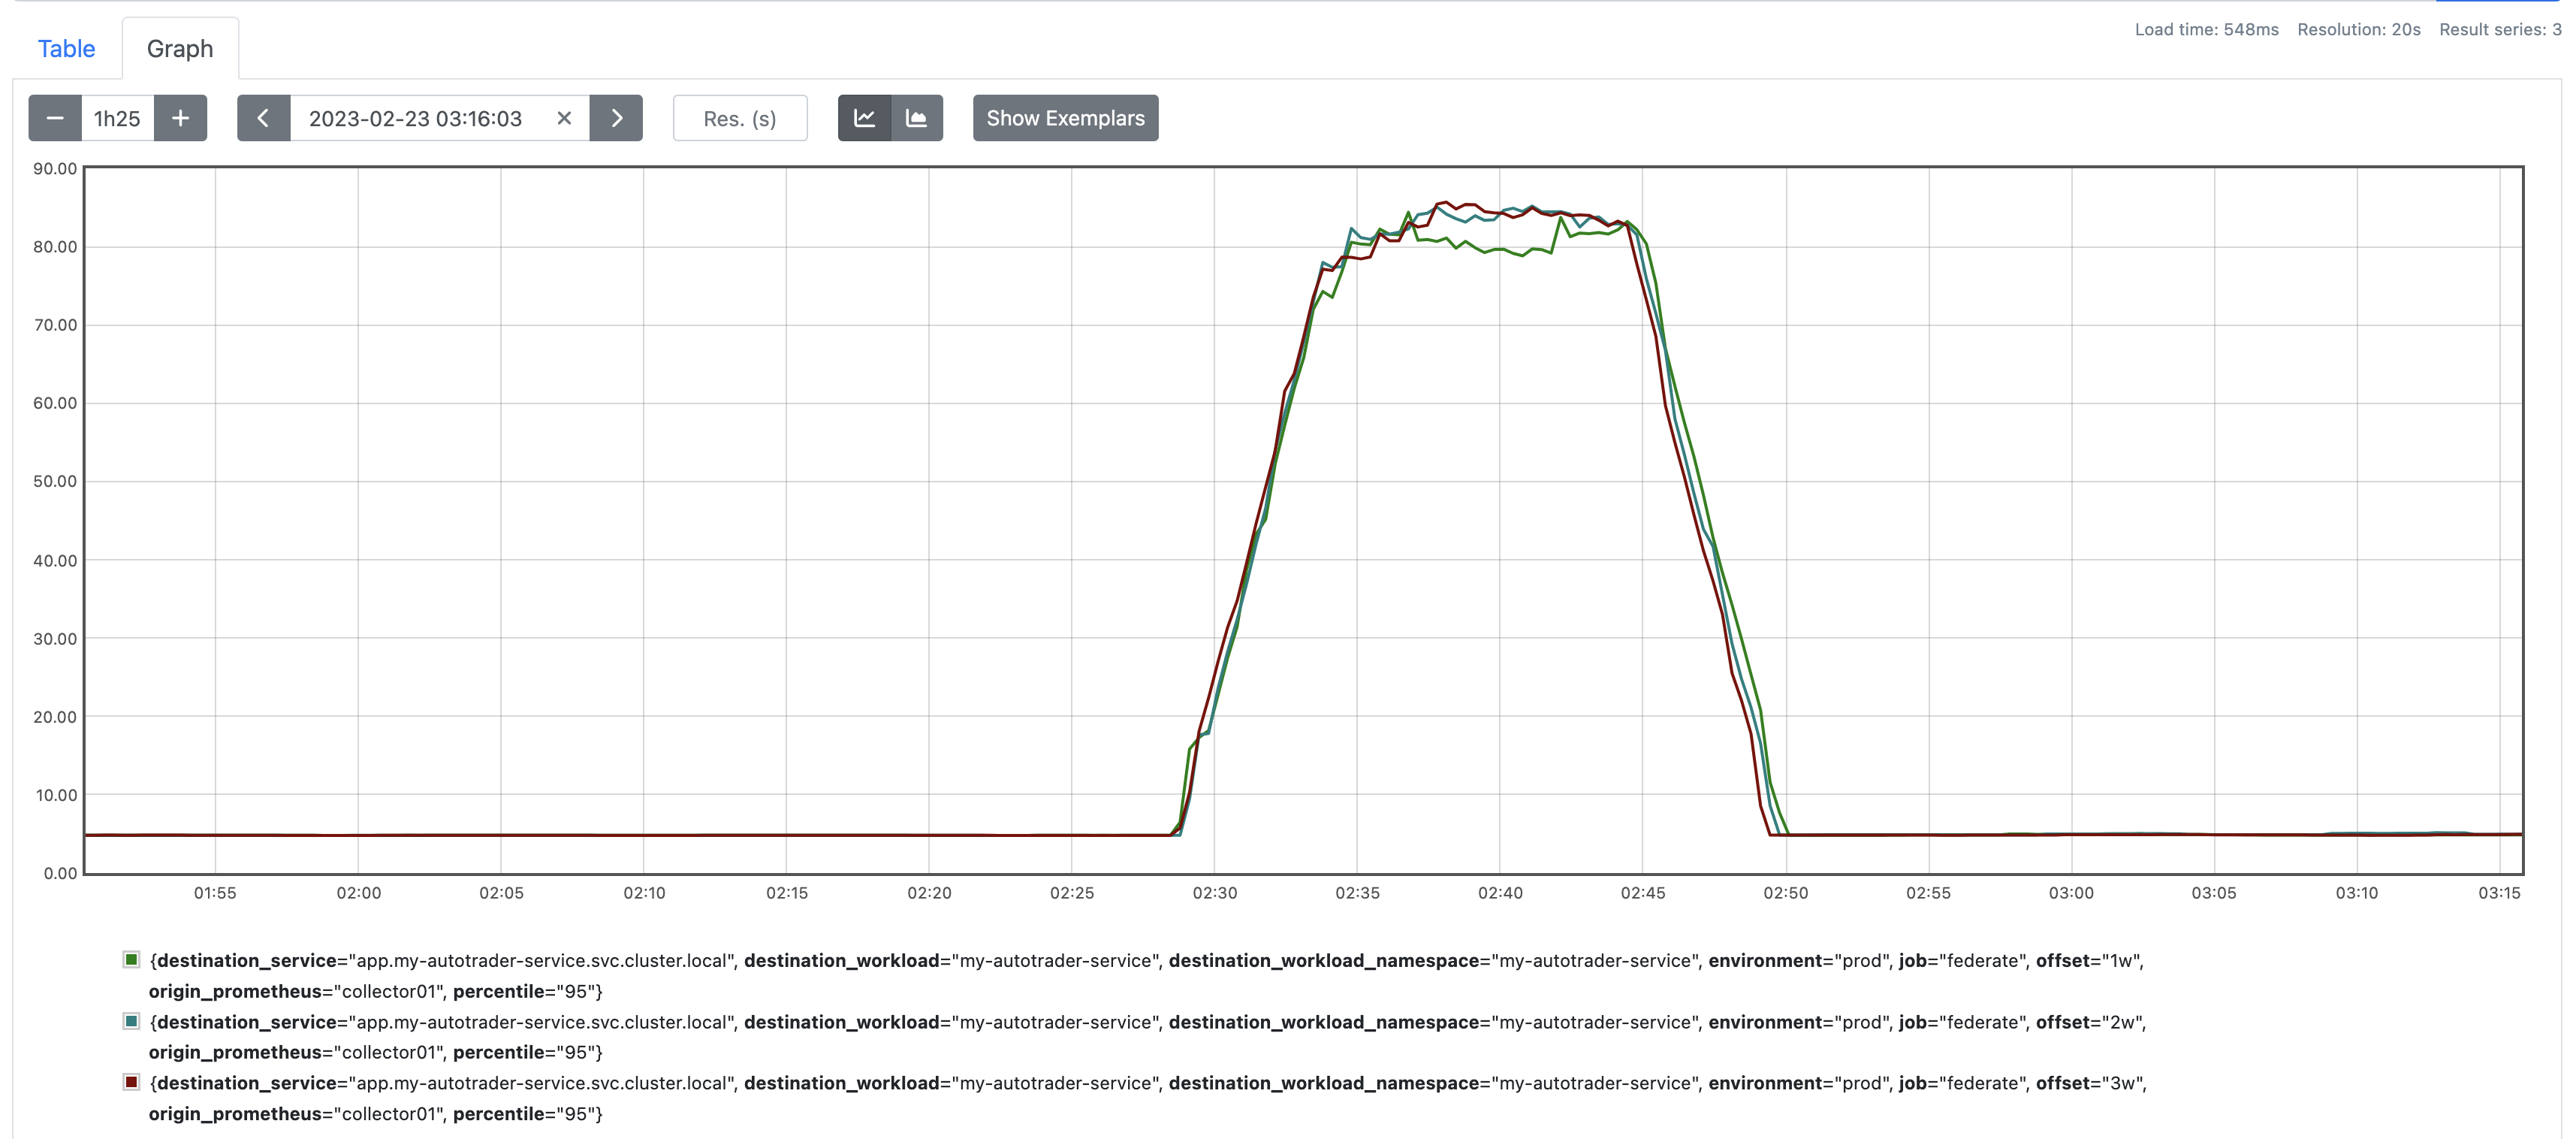
If we look at the current value vs the previous week, we can see why. The previous week (and the weeks before it) had consistently higher response times. The Z-score of -3 (ish) is correct in that the current response time is notably lower than where we'd expect it to be, based on history. Looks like someone made some performance improvements! Good effort!
Alerting
You'll want to gather it for longer periods of time and tweak some of the windowing functions in the examples above to find a threshold that is right for your traffic patterns. The data looks pretty decent for me, so the next thing we want to do is alert on it.
I'm not that bothered when people make performance improvements, I just want to alert when the response time worsens. We could define that as:
When the current response time is more than 3 standard deviations from the mean
Therefore in our case, that's a z-score on our recorded metric of +3.
We don't want it to be too flakey, it's the internet after all, latency spikes happen. So we'll just alert when the z-score has be +3 for 5 minutes or more.
- alert: AnomalyResponseTime
expr: |
anomaly:istio_request_duration_milliseconds_bucket:p95:zscore > 3
for: 5m
labels:
severity: warning
source: '{{ "{{" }}$labels.destination_workload{{ "}}" }}'
annotations:
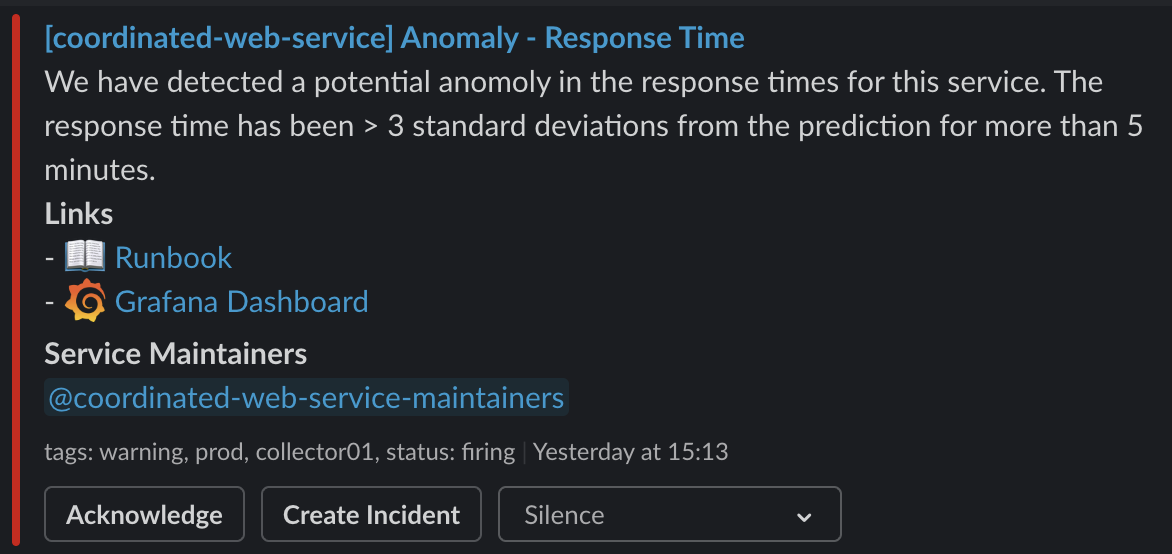
description: >-
We have detected a potential anomoly in the response times for this service.
The response time has been > 3 standard deviations from the prediction for more than 5 minutes.
summary: Anomaly - Response TimeOf all our data there was only one point it went above 3, and it was for less than 5 minutes so we wouldn't have alerted:
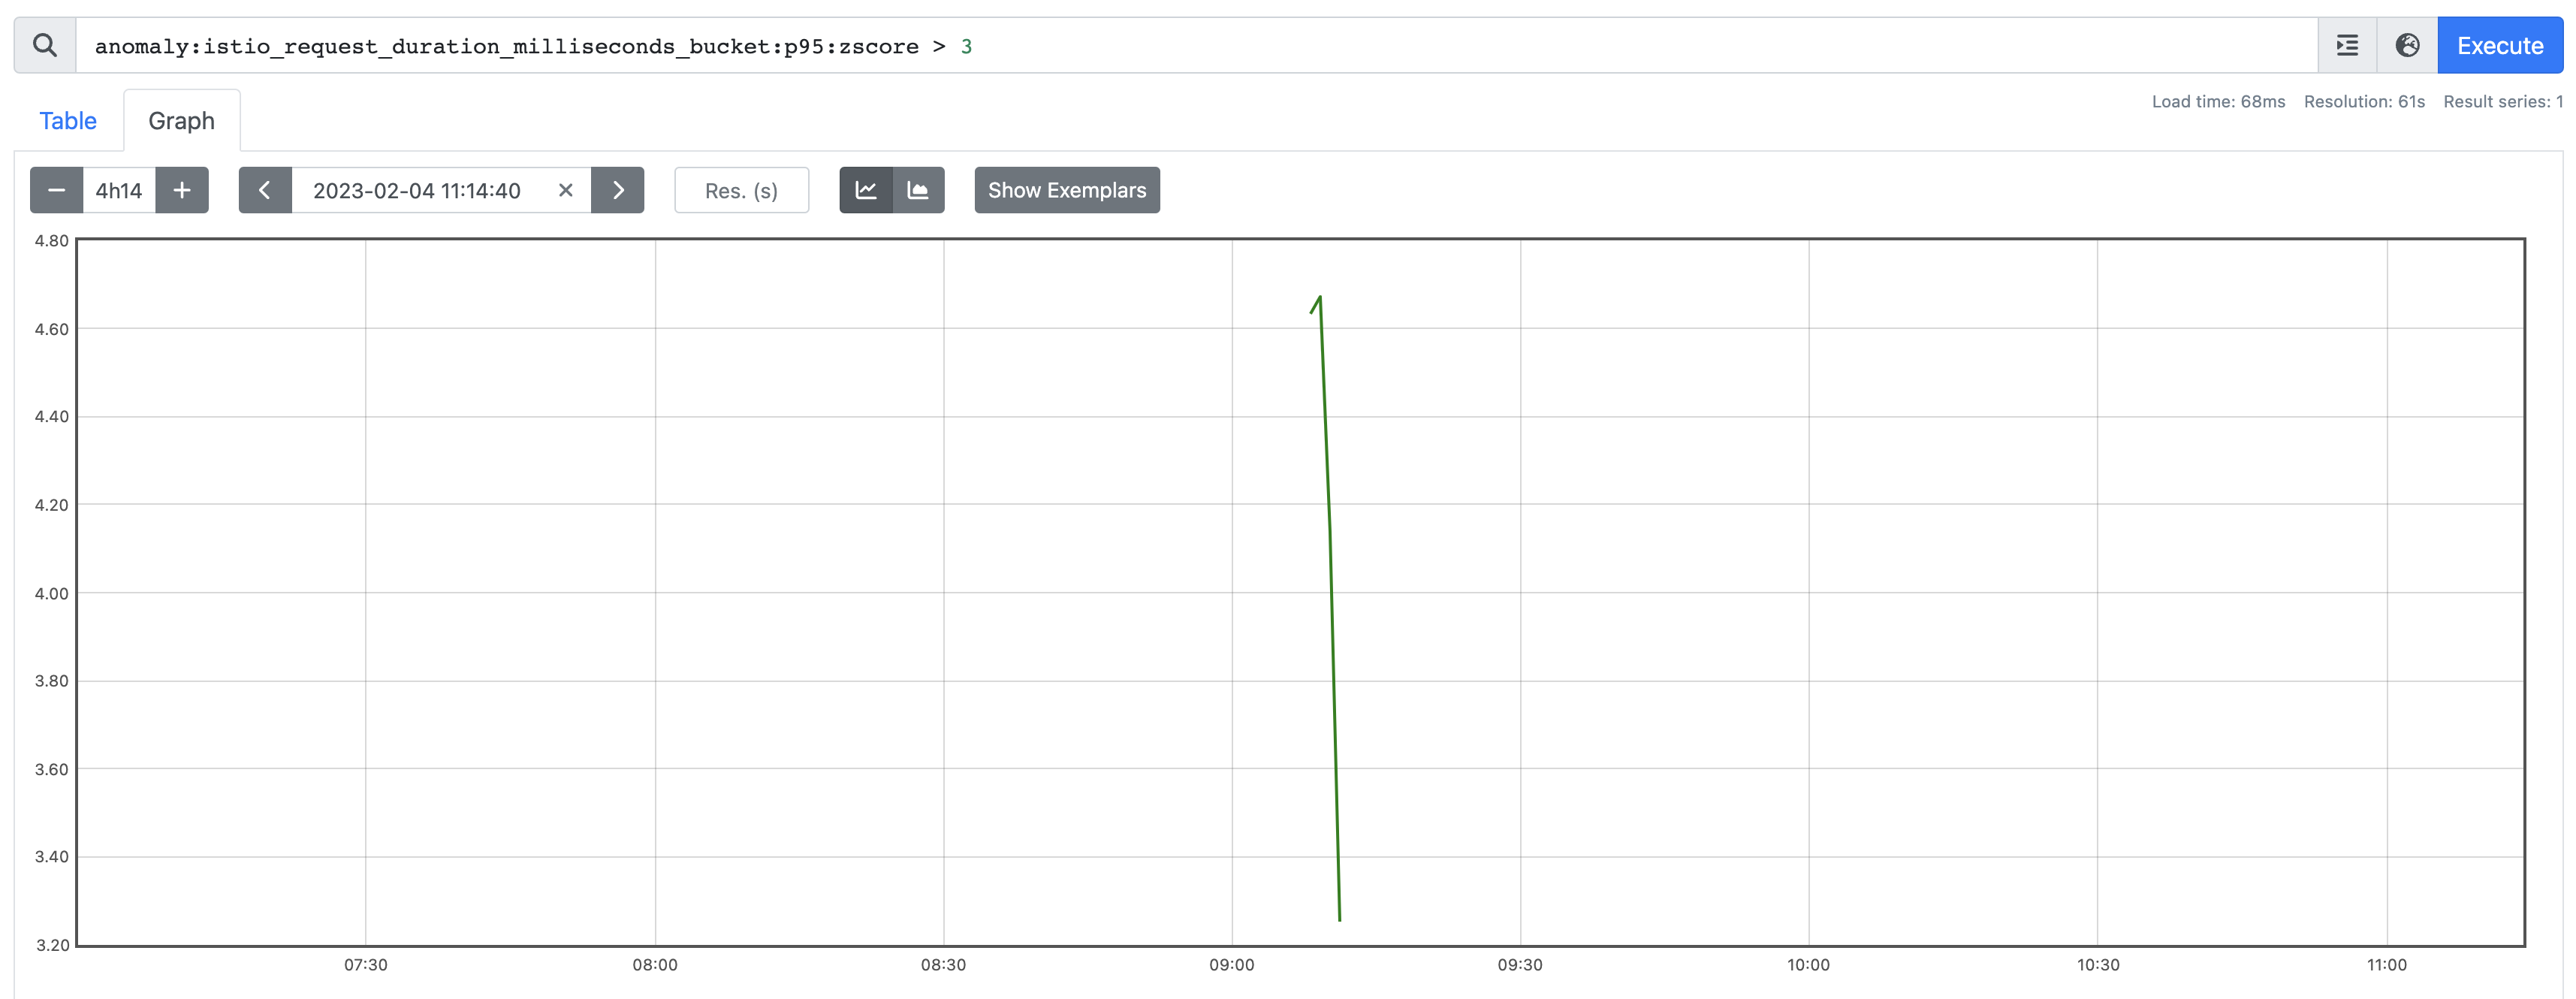
But here's what it looks like when we do:
Backfilling
promtool has a Backfill capability that allows you to historically backfill data from recording rules. Be warned - it's expensive to run and can take absolutely ages depending on the amount of data you are processing.
Here's an example of me backfilling the last 24 hours of data for our new recording rules:
❯ kubectl exec -it prometheus-0 exec -- /bin/promtool tsdb create-blocks-from rules --start $(($(date +%s)-86400)) --end=$(date +%s) --url http://127.0.9.1:9090 /etc/prometheus/alerting.rules/anomaly.yaml
name=/etc/prometheus/alerting.rules/anomaly.yaml;anomaly.istio_request_duration_milliseconds_bucket:destination:rate1m
level=info backfiller="processing rule" id=0 name=anomaly:istio_request_duration_milliseconds_bucket:destination:rate1m:prediction
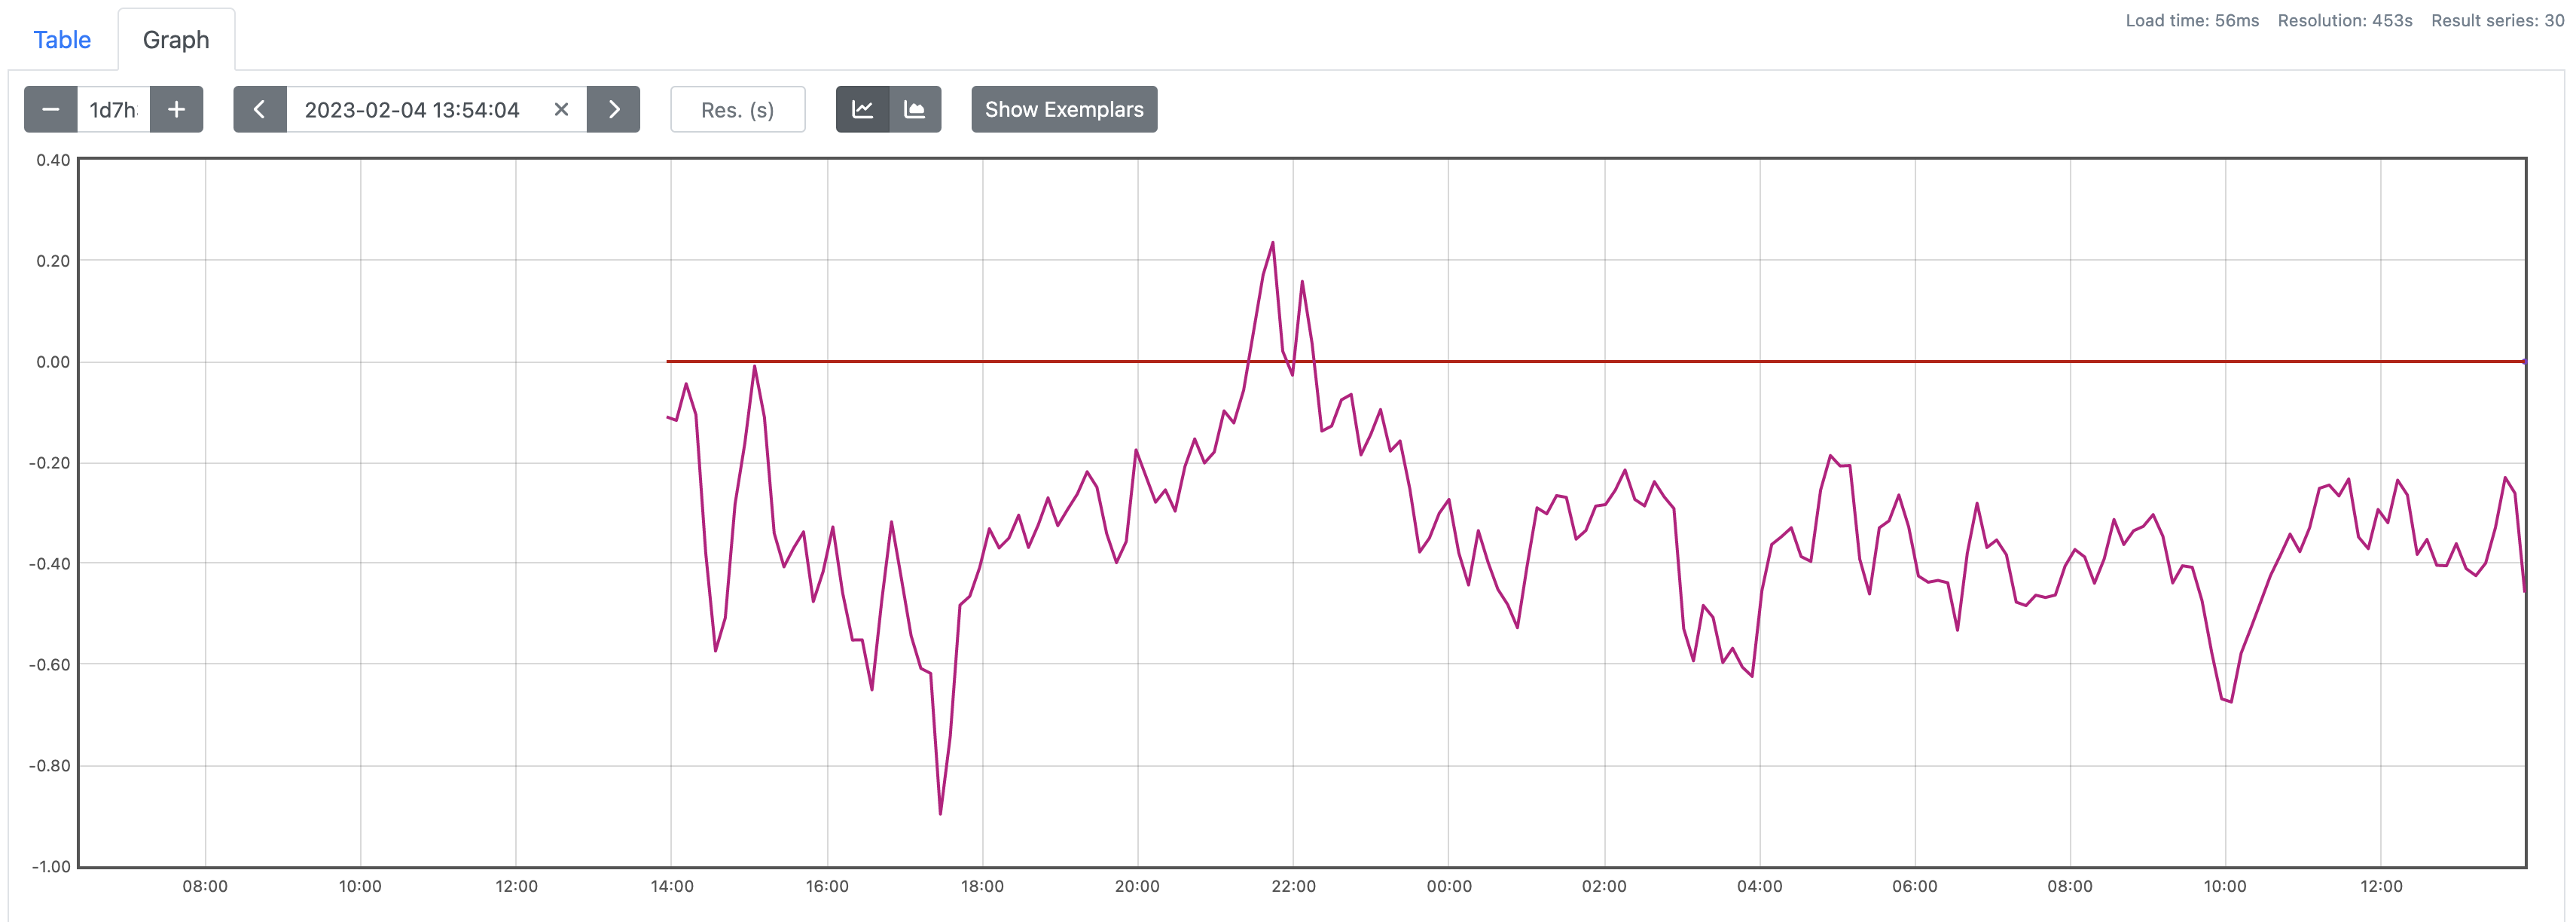
level=info backfiller="processing rule" id=1 name=anomaly:istio_request_duration_milliseconds_bucket:destination:rate1m:zscoreOnce this is complete; you'll need to wait for a compaction event. It'll happen pretty soon after the blocks are written, look for this in your prometheus logs:
ts=2023-02-04T13:51:58.220Z caller=compact.go:460 level=info component=tsdb msg="compact blocks" count=3 mint=1675490400000 maxt=1675512000000 ulid=01GREB5B7VAJ5FQW8A4K298PNX sources="[01GREB59MGV9T946Z2GW798QEQ 01GREB59XTSPZ6AS6X9H3H9PFA 01GREB5AAV4A9SC51C1XFK5DCH]" duration=1.041736959sAnd voila, you can see here I have the last 24 hours of data populated:
Conclusion
Math and statistics are certainly not my strong point! I learned a lot from this excellent GitLab post, but statisticians please do shout up if this can be improved! But saying that I do think I've landed with a reasonable signal for outlier detection without needing to hard code specific values for individual services, which was my goal all along.