Istio: 503's with UC's and TCP Fun Times
503 errors are commonly seen by Istio users, but it's a bit of a catch-all error code. This blog helps you debug them using tcpdump and istio-proxy logs

Today I'm going to look at a rather complex problem we've been debugging at AutoTrader recently (with a lot of help from the Istio folks). Whilst this issue is largely solved, the steps we took may help you debug issues in your own deployments.
The Problem
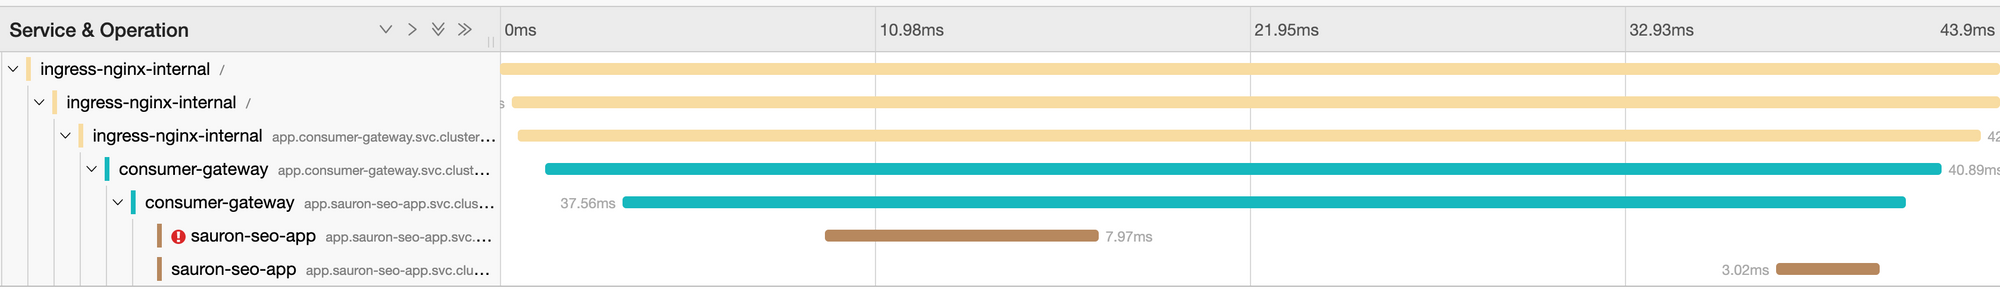
We were noticing some requests were failing on the first attempt, and then being retried automatically by Istio and subsequently succeeding. In traces (Jaeger), it looks like this - with the first request showing a 503 status code with the response_flags of UC.
If you use Istio, or follow Istio, you'll likely have seen numerous issues around 503 errors. The general problem with the way 503's are reported at the moment is it is a bit of a catchall.
Take this really simple example:

Basically anything that goes wrong in Application 2's envoys communication with the application will be wrapped up as a 503 and sent back to the upstream, and then the upstream will retry.
Anyway, retries aren't end of the world, Istio is doing its job, detecting a failure, retrying and then subsequently returning a successful request to the upstream - all totally transparently - go Istio. It is worth noting that you're always going to get failures - and you should build for them. We run our applications spread across multiple Availability Zones, so we're going to see the odd blip, there's lots of things to go wrong.
However we were seeing around about 0.012% of requests fail in this exact manner. We also have a microservice architecture, due to compound failure on a request which say touches 5 applications, you'd see around about a 0.08% failure rate for the aggregate request. Not great and definitely more than the "odd blip".
When you start to think about points of failure as well, it's worth appreciating the added complexity that a sidecar model mesh adds to your applications communication. Nothing comes for free folks.
Give consideration that in a non-service-mesh world, consumer-gateway managed its connection pool to sauron-seo-app directly. However in the service-mesh world, we actually have 3 separate connection pools, rather than one. And each has its own configuration:
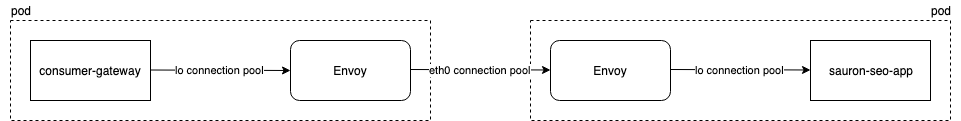
consumer-gatewaytosource-envoy(Configured in Java code)source envoytodestination envoy(Configured in the DestinationRule)destination envoytosauron-seo-app(Configured in Envoy and on by default, but not operator configurable through Istio)
Plenty of opportunity for things to go wrong, and also a much broader range of places we need to look at to find the root cause. So let's play through this real world scenario though and see where our issue is.
Metrics
Istio
Istio collects a whole bunch of metrics that can help us highlight problems. It's interesting really as the level of visibility that Istio offers means it is likely highlighting problems you've had before! They're just now in your face. So open up prometheus and pop in:
sort_desc(sum(changes(istio_requests_total{response_flags="UC", response_code="503", reporter="destination"}[24h])) by (source_app, destination_app, reporter) >0)
What this is saying is: "Give me requests which resulted in a 503, with the response flag UC (upstream connection problem) in the last 24 hours, grouped by source_app, destination_app and reporter).
Note: Taking the example diagram I drew earlier, reporter=source is the source envoy reporter=destination is the destination envoy.
So looking at my top result: {destination_app="sauron-seo-app",reporter="destination",source_app="consumer-gateway"} 58 - this tells me that over the last 24 hours, 58 requests failed between consumer-gateway to sauron-seo-app resulted in a 503UC and then were reported from the envoy next to sauron-seo-app.
Ok great, we know we're having some issues at the destination, and this matches up with what we're seeing in our trace as the source is retrying to a different destination and succeeding. Let's check out what's going on with envoy.
Envoy
The next thing we want to do is enable some metrics to help us debug envoy. By default, istio-proxy only enables some core envoy metrics to keep the footprint down. We want a little more information. Adding the following annotation to the Deployment will give you that:
sidecar.istio.io/statsInclusionPrefixes: cluster.outbound,listener,cluster,cluster_manager,listener_manager,http_mixer_filter,tcp_mixer_filter,server,cluster.xds-grpc
Note: These metrics are disabled by default because they have relatively high cardinality. I personally only enable them when I'm debugging a problem, and turn them off afterwards.
Once they're enabled, you'll have access to shiny metrics like envoy_cluster_upstream_cx_destroy_local_with_active_rq and envoy_cluster_upstream_cx_destroy_remote_with_active_rq. These metrics are from envoys perspective, so local and remote are as follows:
envoy_cluster_upstream_cx_destroy_local_with_active_rq
Total connections destroyed locally with 1+ active request
Sounds grim, right? Nobody wants active requests being killed and our destination envoy was reporting a whole bunch of remote destroys, and our source envoy had a whole bunch of local destroys.
It can get a bit confusing, so I find the easiest way to debug is to graph them next to each other. You can see the local metric is being reported on the source envoy, and the remote metric being reported on the destination.
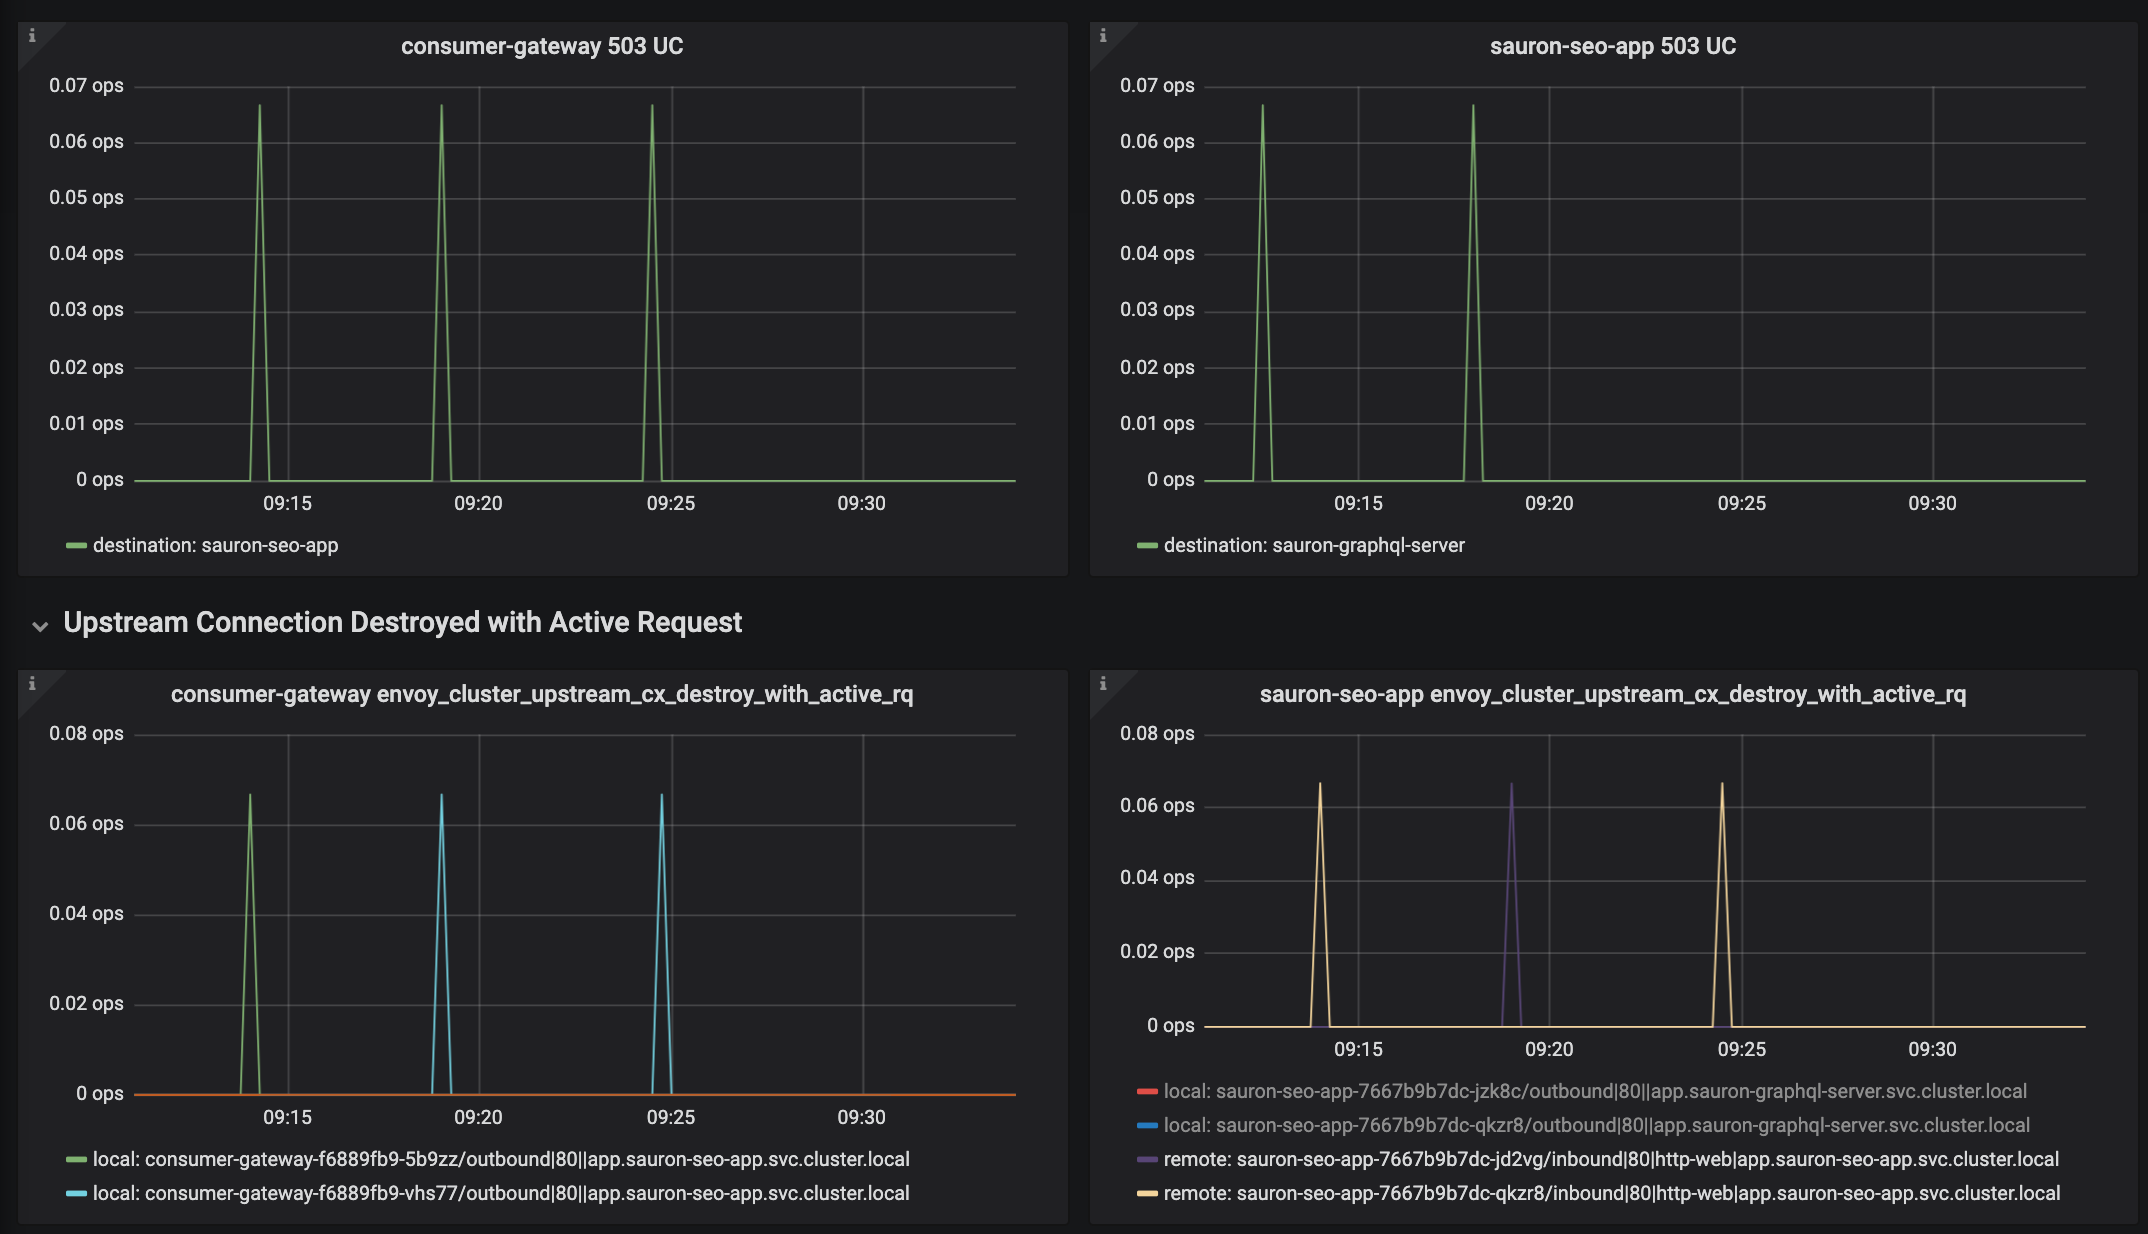
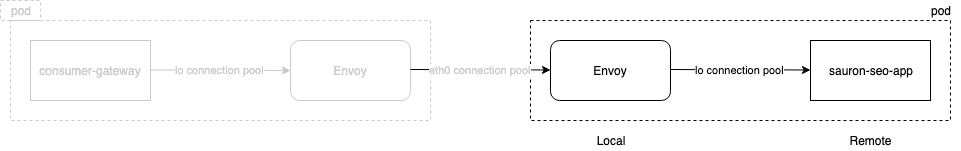
What this is basically telling us is that the connection between the sauron-seo-app envoy and application has been closed - and it looks like it was sauron-seo-app that closed it (remote close). Then the consumer-gateway envoy is is subsequently closing that connection too. This makes sense as consumer-gateway received a 5xx response on a http1.1 connection (which is what envoy to envoy uses in its connection pool at the moment). No further data can be sent on that connection so it has no choice but to close it (local close).
Note: This isn't the case for http2.0, and it is looking likely that Istio 1.2 will have the ability to switch on http2.0 for envoys connection pool.
This confirms we need to narrow our investigation to sauron-seo-app.
Istio-proxy debug logs
Istio-proxy enables you to toggle multiple log levels at run time, which can help to debug these sorts of issues. So let's set all of them to debug, on sauron-seo-app and see what we can find:
kubectl -n sauron-seo-app sauron-seo-app-7667b9b7dc-jd3vg -c istio-proxy -- curl -XPOST -s -o /dev/null http://localhost:15000/logging?level=debug
And then you'll want to tail with kubectl -n sauron-seo-app logs -f sauron-seo-app-7667b9b7dc-jd3vg -c istio-proxy - be warned; these are very noisy. You'll be looking to find your 503 segment:
[2019-05-30 08:24:09.206][34][debug][router] [external/envoy/source/common/router/router.cc:644] [C77][S184434754633764276] upstream reset: reset reason connection termination

[2019-05-30 08:24:09.206][34][debug][filter] [src/envoy/http/mixer/filter.cc:133] Called Mixer::Filter : encodeHeaders 2

[2019-05-30 08:24:09.206][34][debug][http] [external/envoy/source/common/http/conn_manager_impl.cc:1305] [C77][S184434754633764276] encoding headers via codec (end_stream=false):
 ':status', '503'
 'content-length', '95'
 'content-type', 'text/plain'
 'date', 'Thu, 30 May 2019 08:24:08 GMT'
 'server', 'istio-envoy'


[2019-05-30 08:24:09.208][34][debug][connection] [external/envoy/source/common/network/connection_impl.cc:502] [C77] remote close

[2019-05-30 08:24:09.208][34][debug][connection] [external/envoy/source/common/network/connection_impl.cc:183] [C77] closing socket: 0
OK. We can see our 503 on connection [C77] - if we follow that back a little we can also see upstream reset: reset reason connection termination on [C77]. Istio-proxy is telling us that the upstream reset connection 77 (the upstream in this case - being our application). Further validating our theory that envoy believes sauron-seo-app is closing the connection.
Packet Captures
At this point in time we've exhausted all the metrics Istio and Envoy make available to us, we've narrowed it down to the destination application seemingly terminating the connection. Time to packet capture and try and work out what is going on.
In order to do this on kubernetes we used a utility called ksniff. Which I have to be honest - is just brilliant. As we run unprivileged containers we are unable to do tcpdumps within the application. knsiff will:
- Detect what node your target app is running on
- Deploy a pod with an affinity to that node, bound to the host network
- TCP Dump traffic from the privileged application and stream it right back to wireshark on your laptop as if it was local.
TCP Dumps are very noisy, so we would want to filter a little:
- We are looking for information about TCP connection events, so let's just look for
SYN,FINandRST. - As we're investigating traffic between the local envoy and application, we only want to look at localhost, so
-i lowill target the loopback adapter.
kubectl sniff $pod -p -n $namespace -c istio-proxy -f 'tcp[tcpflags] & (tcp-syn|tcp-fin|tcp-rst) != 0' -i lo
We were then very quickly able to see the connection RST, confirming the connection was indeed being closed by our application.

Now this is perfectly reasonable, and envoy should be able to deal with upstream connections that are closed. However in a very small number (0.003%) of our requests, we were observing envoy attempting to send data on a connection that had been closed by the application. The Istio team are still working on understanding why that is (likely a race condition between the server sending RST and envoy reusing a connection from its pool), and will be handling the scenario better (improvements are due 1.1.8+ onwards).
One eagle eye'd Istio member did notice however was that there was always roughly 5 seconds between the connection starting (SYN) and the reset (RST).
Our server was nodejs, and some quick googling around led me to the nodejs documentation which clearly states:
Timeout in milliseconds. Default: 5000 (5 seconds). The number of milliseconds of inactivity a server needs to wait for additional incoming data, after it has finished writing the last response, before a socket will be destroyed.Ahhh interesting, so even though envoy creates a connection pool to the application in this case the application will kill the socket if it's been idle after 5 seconds! That's not very long at all.
TCP Socket Timeouts
We did some digging, as we weren't just seeing this in nodejs. We were seeing it to a lesser extent in python applications, and an even lesser extent in java/tomcat. It turns out that they have the following default socket timeouts:
- nodejs: 5 seconds
- python: 10 seconds
- tomcat: 20 seconds
So the lower the socket timeout, the more RST we would get, and the more exacerbated the 503 issue would present.
Even though the Istio team are actively looking at improving this mechanism, we discovered we can quite easily work around it by setting a higher socket keep alive setting in the destination application.
Fixing it in express (nodejs):
const server = app.listen(port, '0.0.0.0', () => {
  logger.info(`App is now running on http://localhost:${port}`)
})
server.keepAliveTimeout = 1000 * (60 * 6) // 6 minutes
Fixing it in cherrpy (pyhton):
global_config = {
  'server.socket_timeout': 6 * 60,
}
cherrypy.config.update(global_config)
Fixing it in tomcat (java-spring):
server:
  connect-timeout: 360000
Fixing it in jetty (java-jetty):
ServerConnector connector = new ServerConnector(jettyServer);
Integer idleTimeoutInMinutes = 6;
connector.setIdleTimeout(idleTimeoutInMinutes * 60 * 1000);
And the result, have a guess what time we started rolling out the fixes:
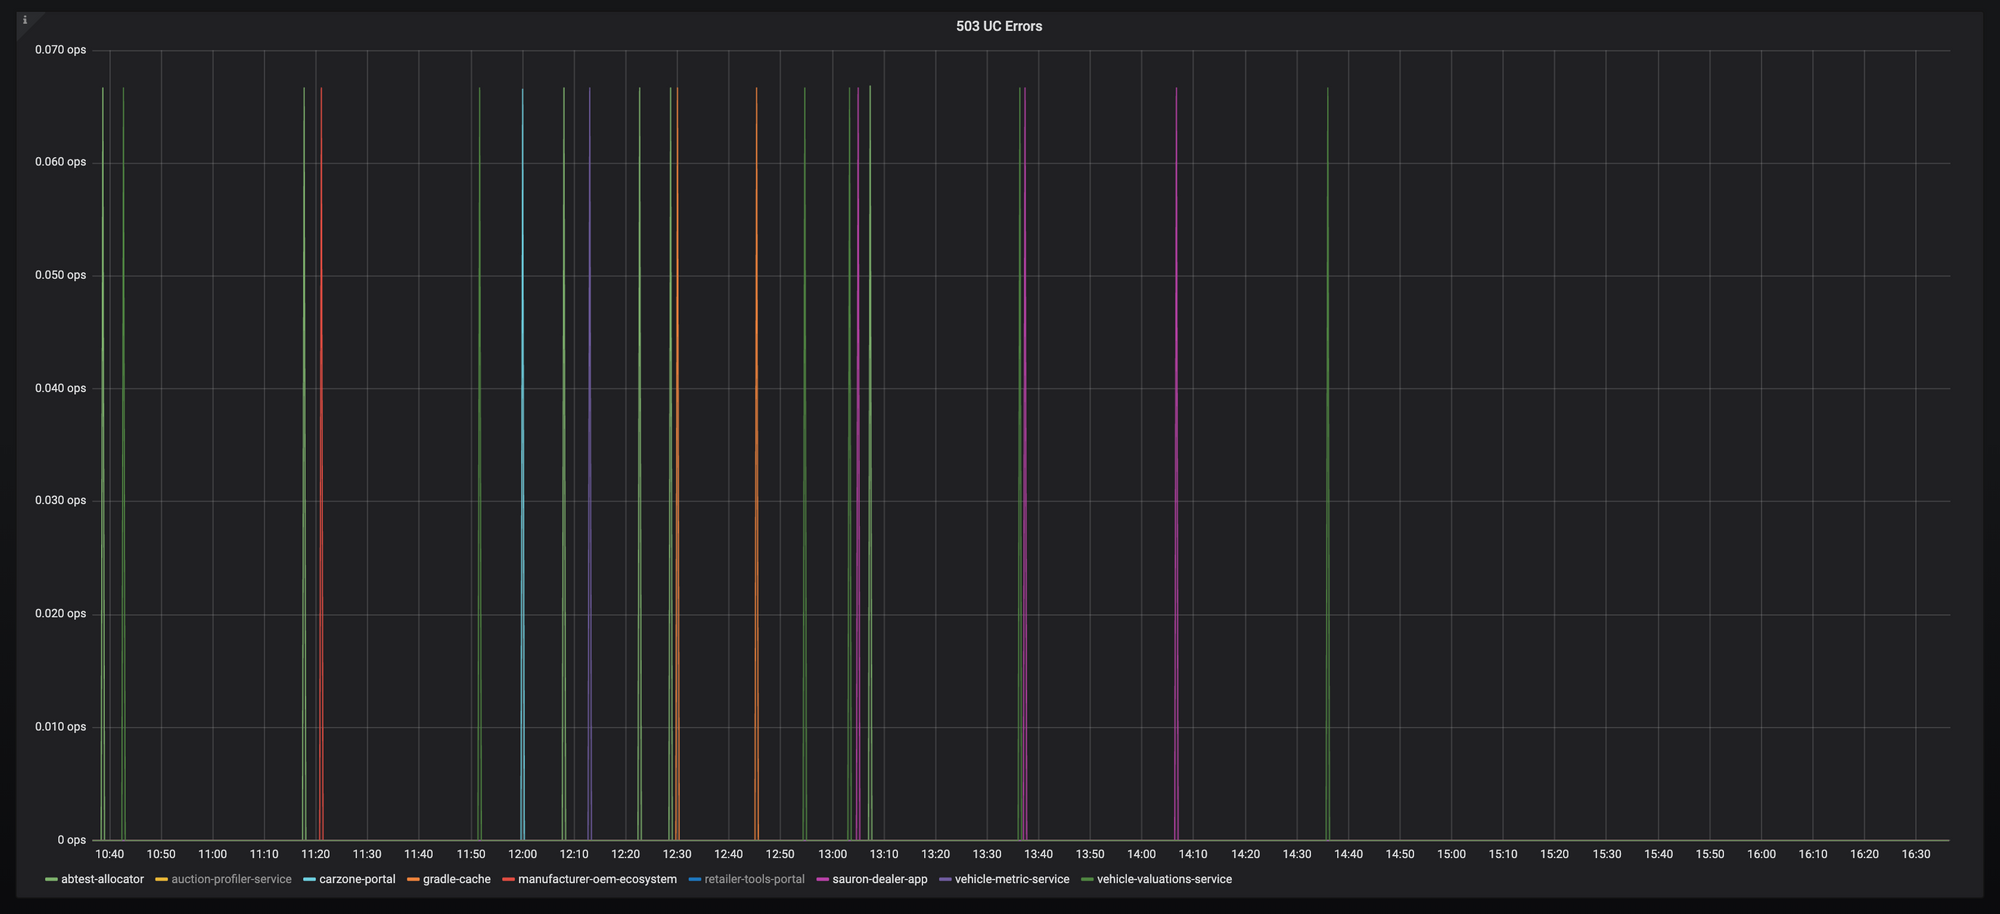
And that is the end of this barrel of laughs.
I know the Istio team are focused on improving the UX here, handling these sorts of scenarios as efficiently as possible to make Istio as performant as possible out of the box for as many users as possible. So I'm confident it will only get better.
Big thanks to Chris McKean on my team for his help as well as numerous folks at Istio. Even if you don't have this specific issue; hopefully these debugging steps will help you get to the bottom of your own.
Time for a beer.