Managing your costs on Kubernetes

I've been doing quite a lot of work around managing cost in Public Cloud recently, specifically with Kubernetes and Google Cloud Platform.
One of the key topics of conversation that always gets brought up during on-prem/private cloud to public cloud migrations is cost. There is generally a shift towards more dynamic, usage driven OpEx costs, vs the previously more predictable longer term CapEx. When you start to throw around terms like "AutoScaling", "Sustained Usage Discounts", "Preemptible VMs", and a whole bunch of other factors people can start to get nervous. And with good reason, I've seen it before, so much capacity at your fingertips it is very easy to grow organically and before you know it you don't know why your bill is so large or why someone in the finance department has just died.
It's also worth pointing out that the solution here isn't just on the operational side of the fence. We want to empower product teams to make right sizing and scaling decisions for their applications. How can we expect them to do this if we don't provide holistic, consistent views of their applications and the rest of the cluster? It's everyones concern.
This blog post is going to take you through how you can use Prometheus, Grafana and Kubernetes metrics to create rich dashboards, helping you to visualise the cost of your applications.
Google Cloud
I work for Auto Trader. We have compute in Google, in Amazon, in Azure, and in our own Data Centres depending on the problem we're trying to tackle. One of the most recent use cases we have been working on is migrating a bunch of our compute capability to Kubernetes. We decided to use Google Container Engine, which is a managed Kubernetes offering - rather than building and managing it ourselves and have been very happy with it.
Subsequently, these dashboards below are targeting pricing on Google Cloud Platform. However there's nothing to stop you tweaking them for other cloud providers.
Resource Requests
In the Public Cloud, and at a high we're paying for CPU, RAM, and Storage. On a Kubernetes cluster we provision nodes to give us that capacity, but we need to also ensure an individual application is reserved a slice of that capacity. I won't repeat what's already out there - have a read of managing compute container resources, and ensure that you're setting quotas for your pods. There are a multitude of reasons to do this, not just cost analysis. So crack on with it.
Gathering the data
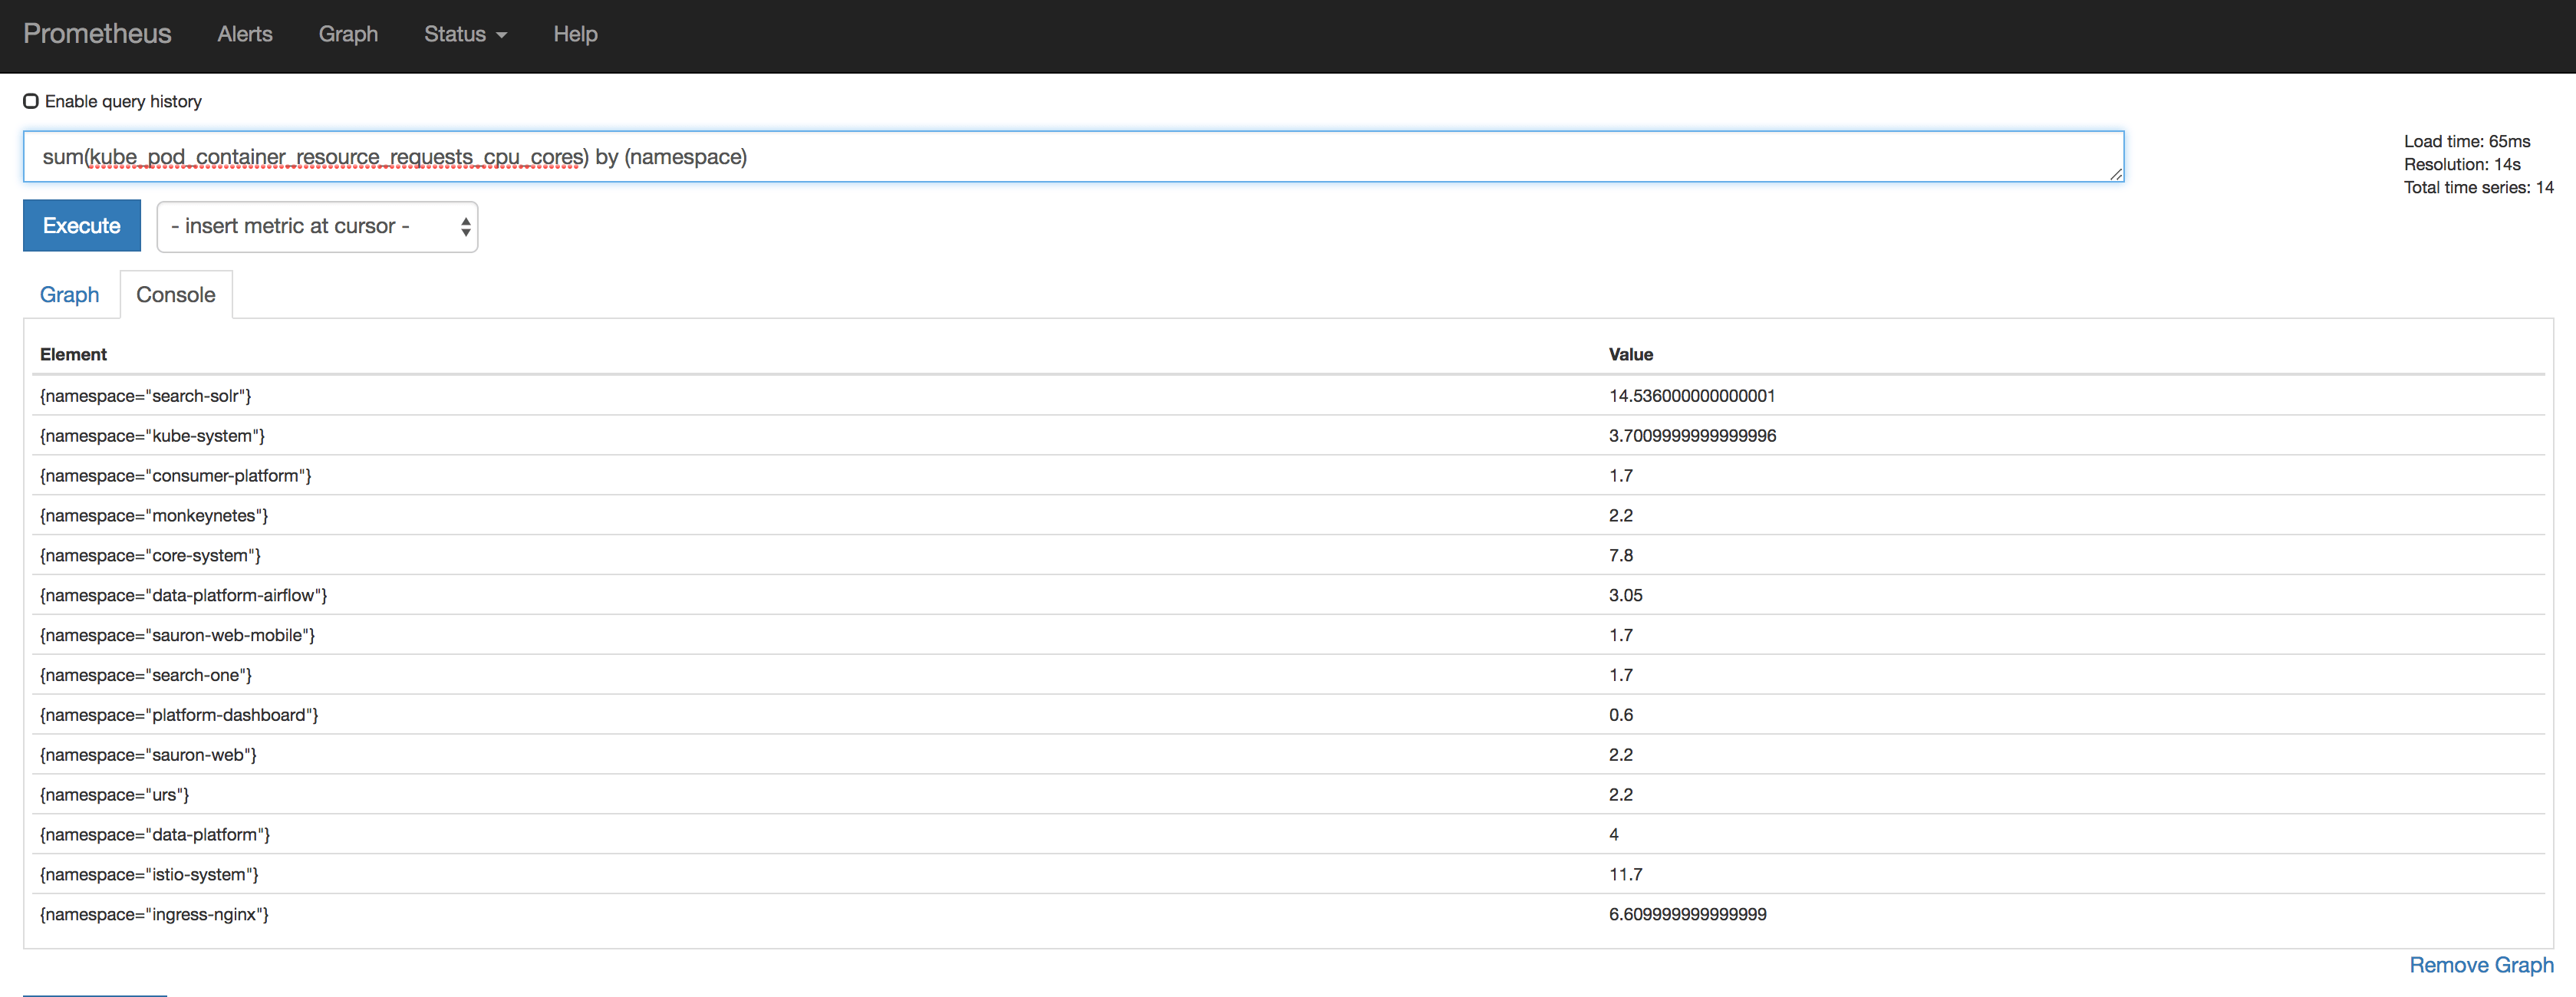
As I mentioned previously, I'm using the time series database Prometheus to gather the metrics. We deploy kube-state-metrics onto the Kubernetes cluster which exposes things like kube_pod_container_resource_limits_cpu_cores for each of our pods. We're then able to aggregate on namespace, node, cluster and so on to produce rich dashboards. Once running on your cluster, kube-state-metrics can be scraped with a prometheus config like this one. This should give you metrics into prometheus, here I am querying how much CPU has been requested, by namespace:
Graphing it all up
We use Grafana for this. We capture a lot of data, and there were some key perspectives that we wanted to give clear visibility around. Rather than trying to cram that all into a single dashboard we decided to break it up into three different perspectives, getting more granular within your cluster as we go.
We also use a mixture of reserved and preemptible machines to save cost. You can adjust all of the values used to compute cost along the top of the dashboard(s).
Cluster Overview

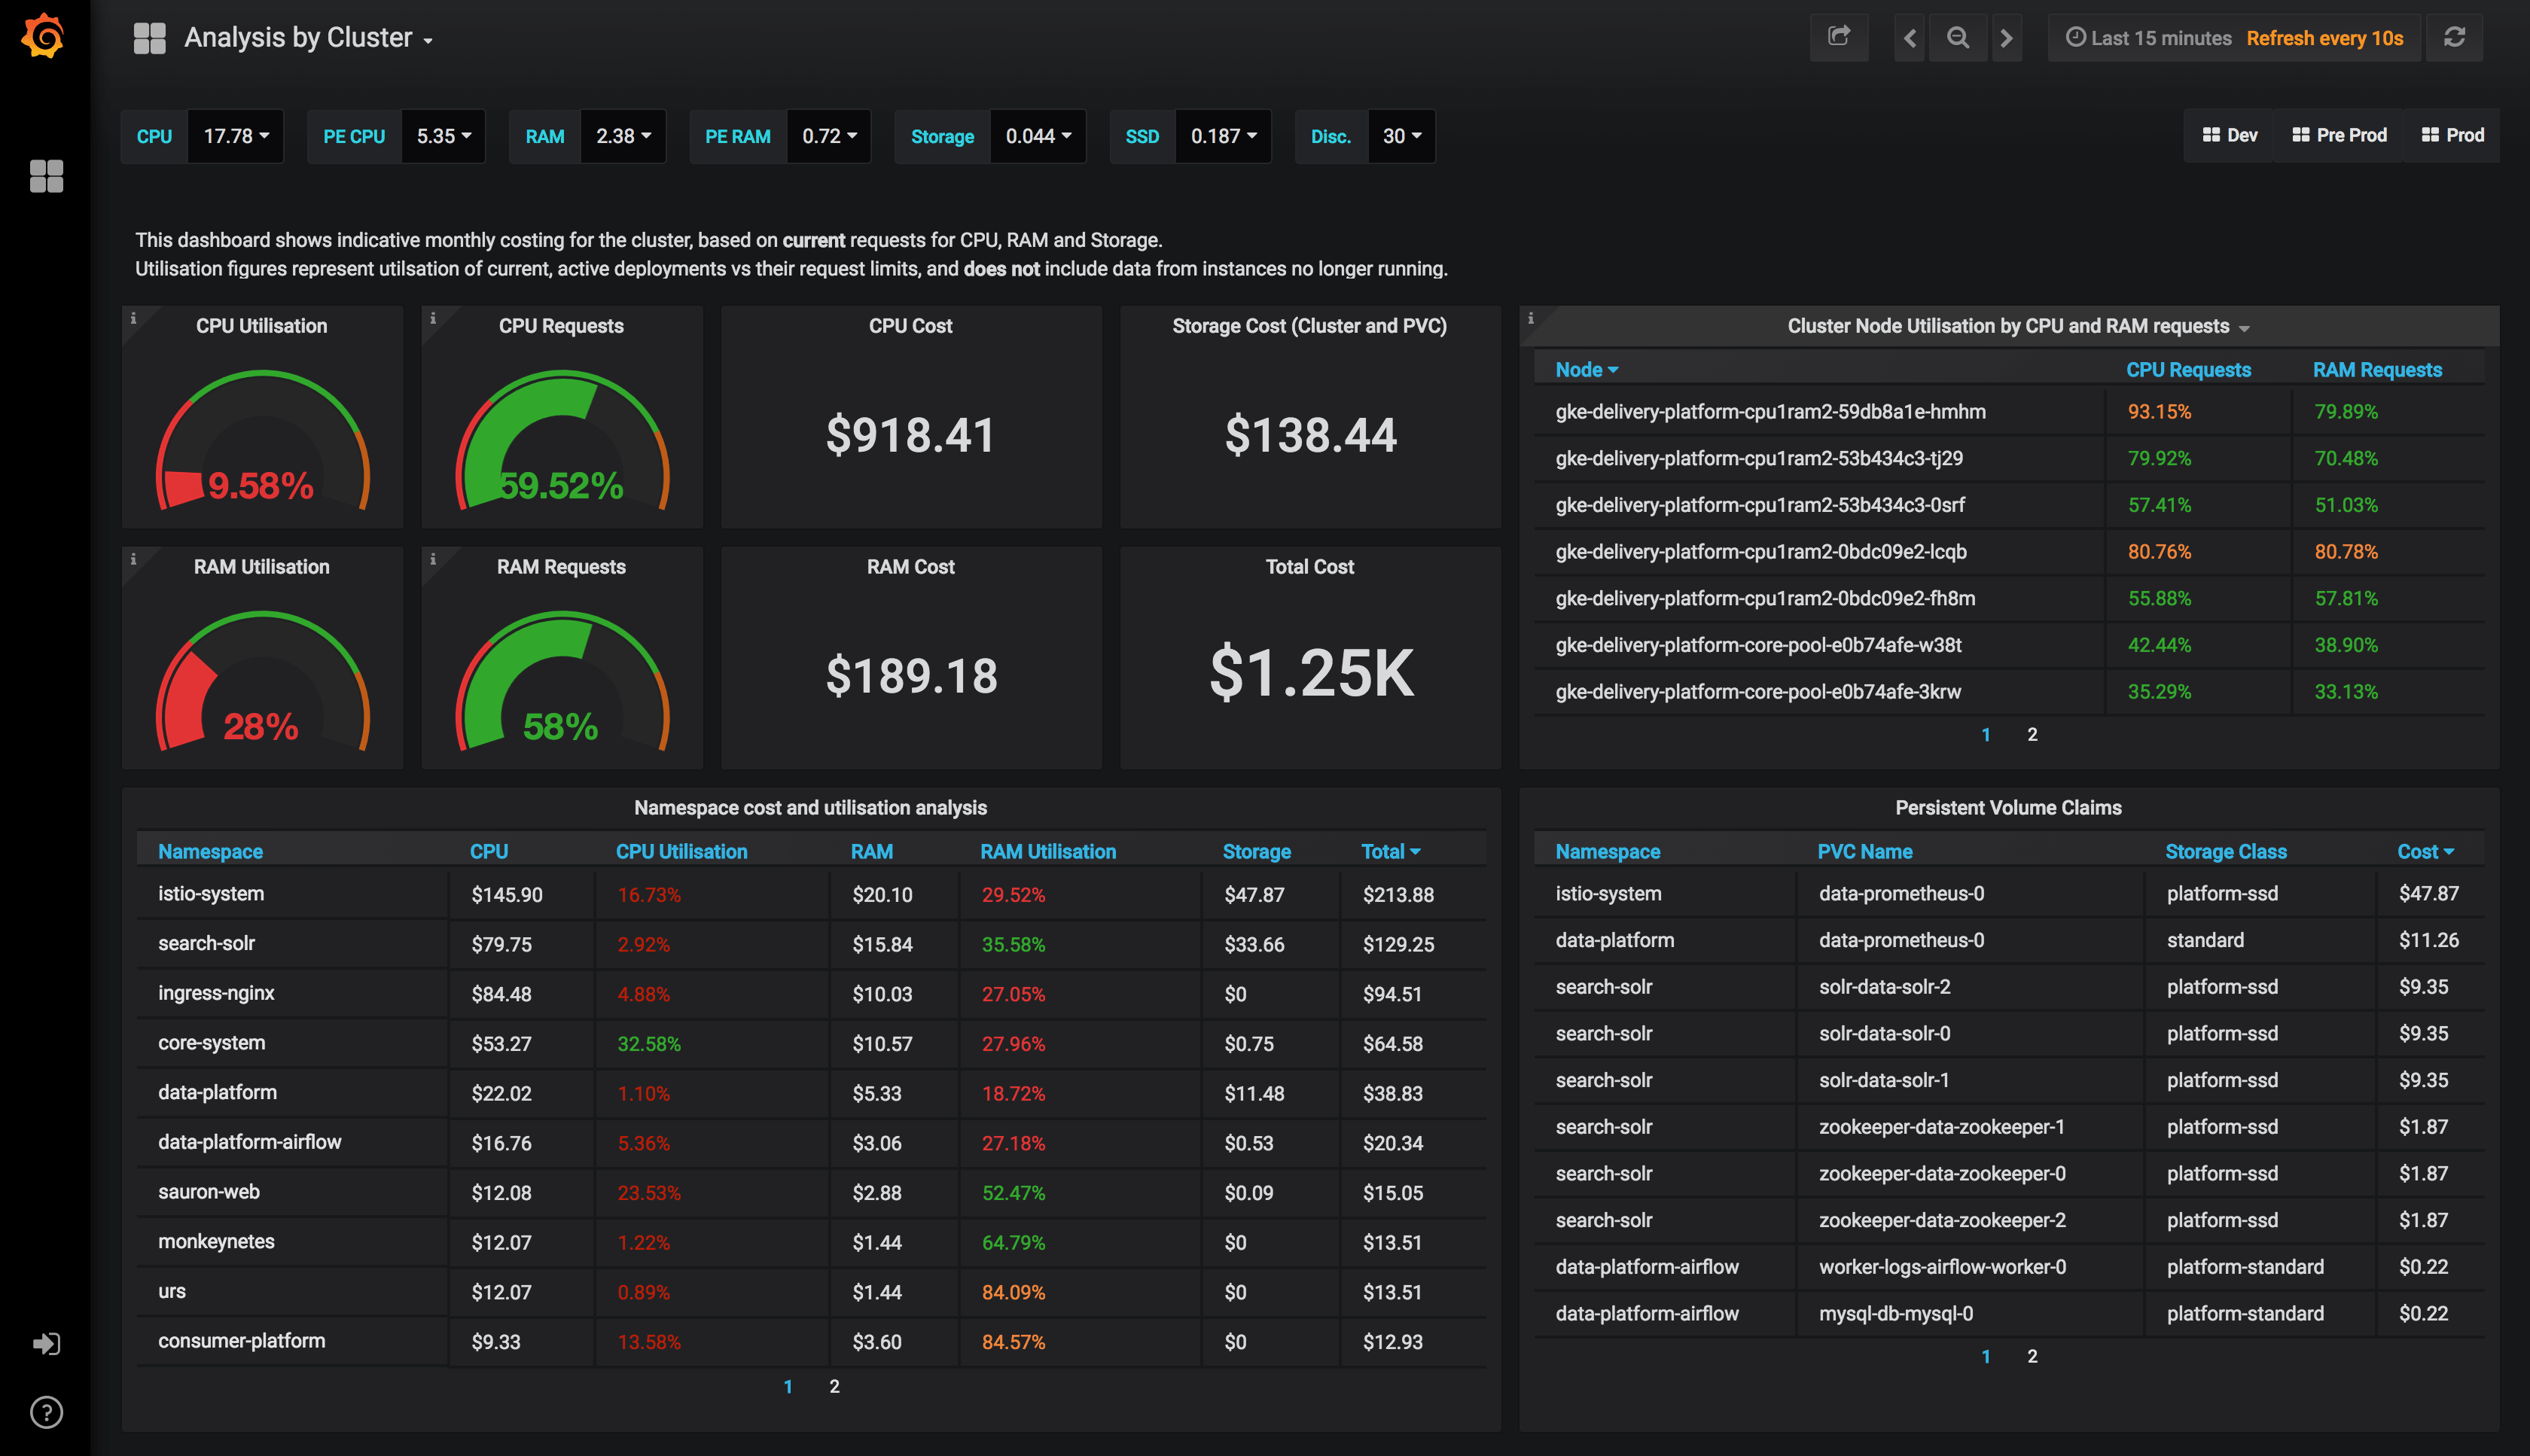
The grand daddy dashboard. The one with the big numbers on, giving you that high level overview of your capacity, your utilisation based on your container requests, your utilisation based on actual cpu and ram. It breaks down namespaces and PersistentVolumeClaims too.
Utilisation is calculated as an average of your CPU and RAM usage vs the Requests on your Pods, the time window you specify.
get the dashboard on grafana.com
Namespace Overview
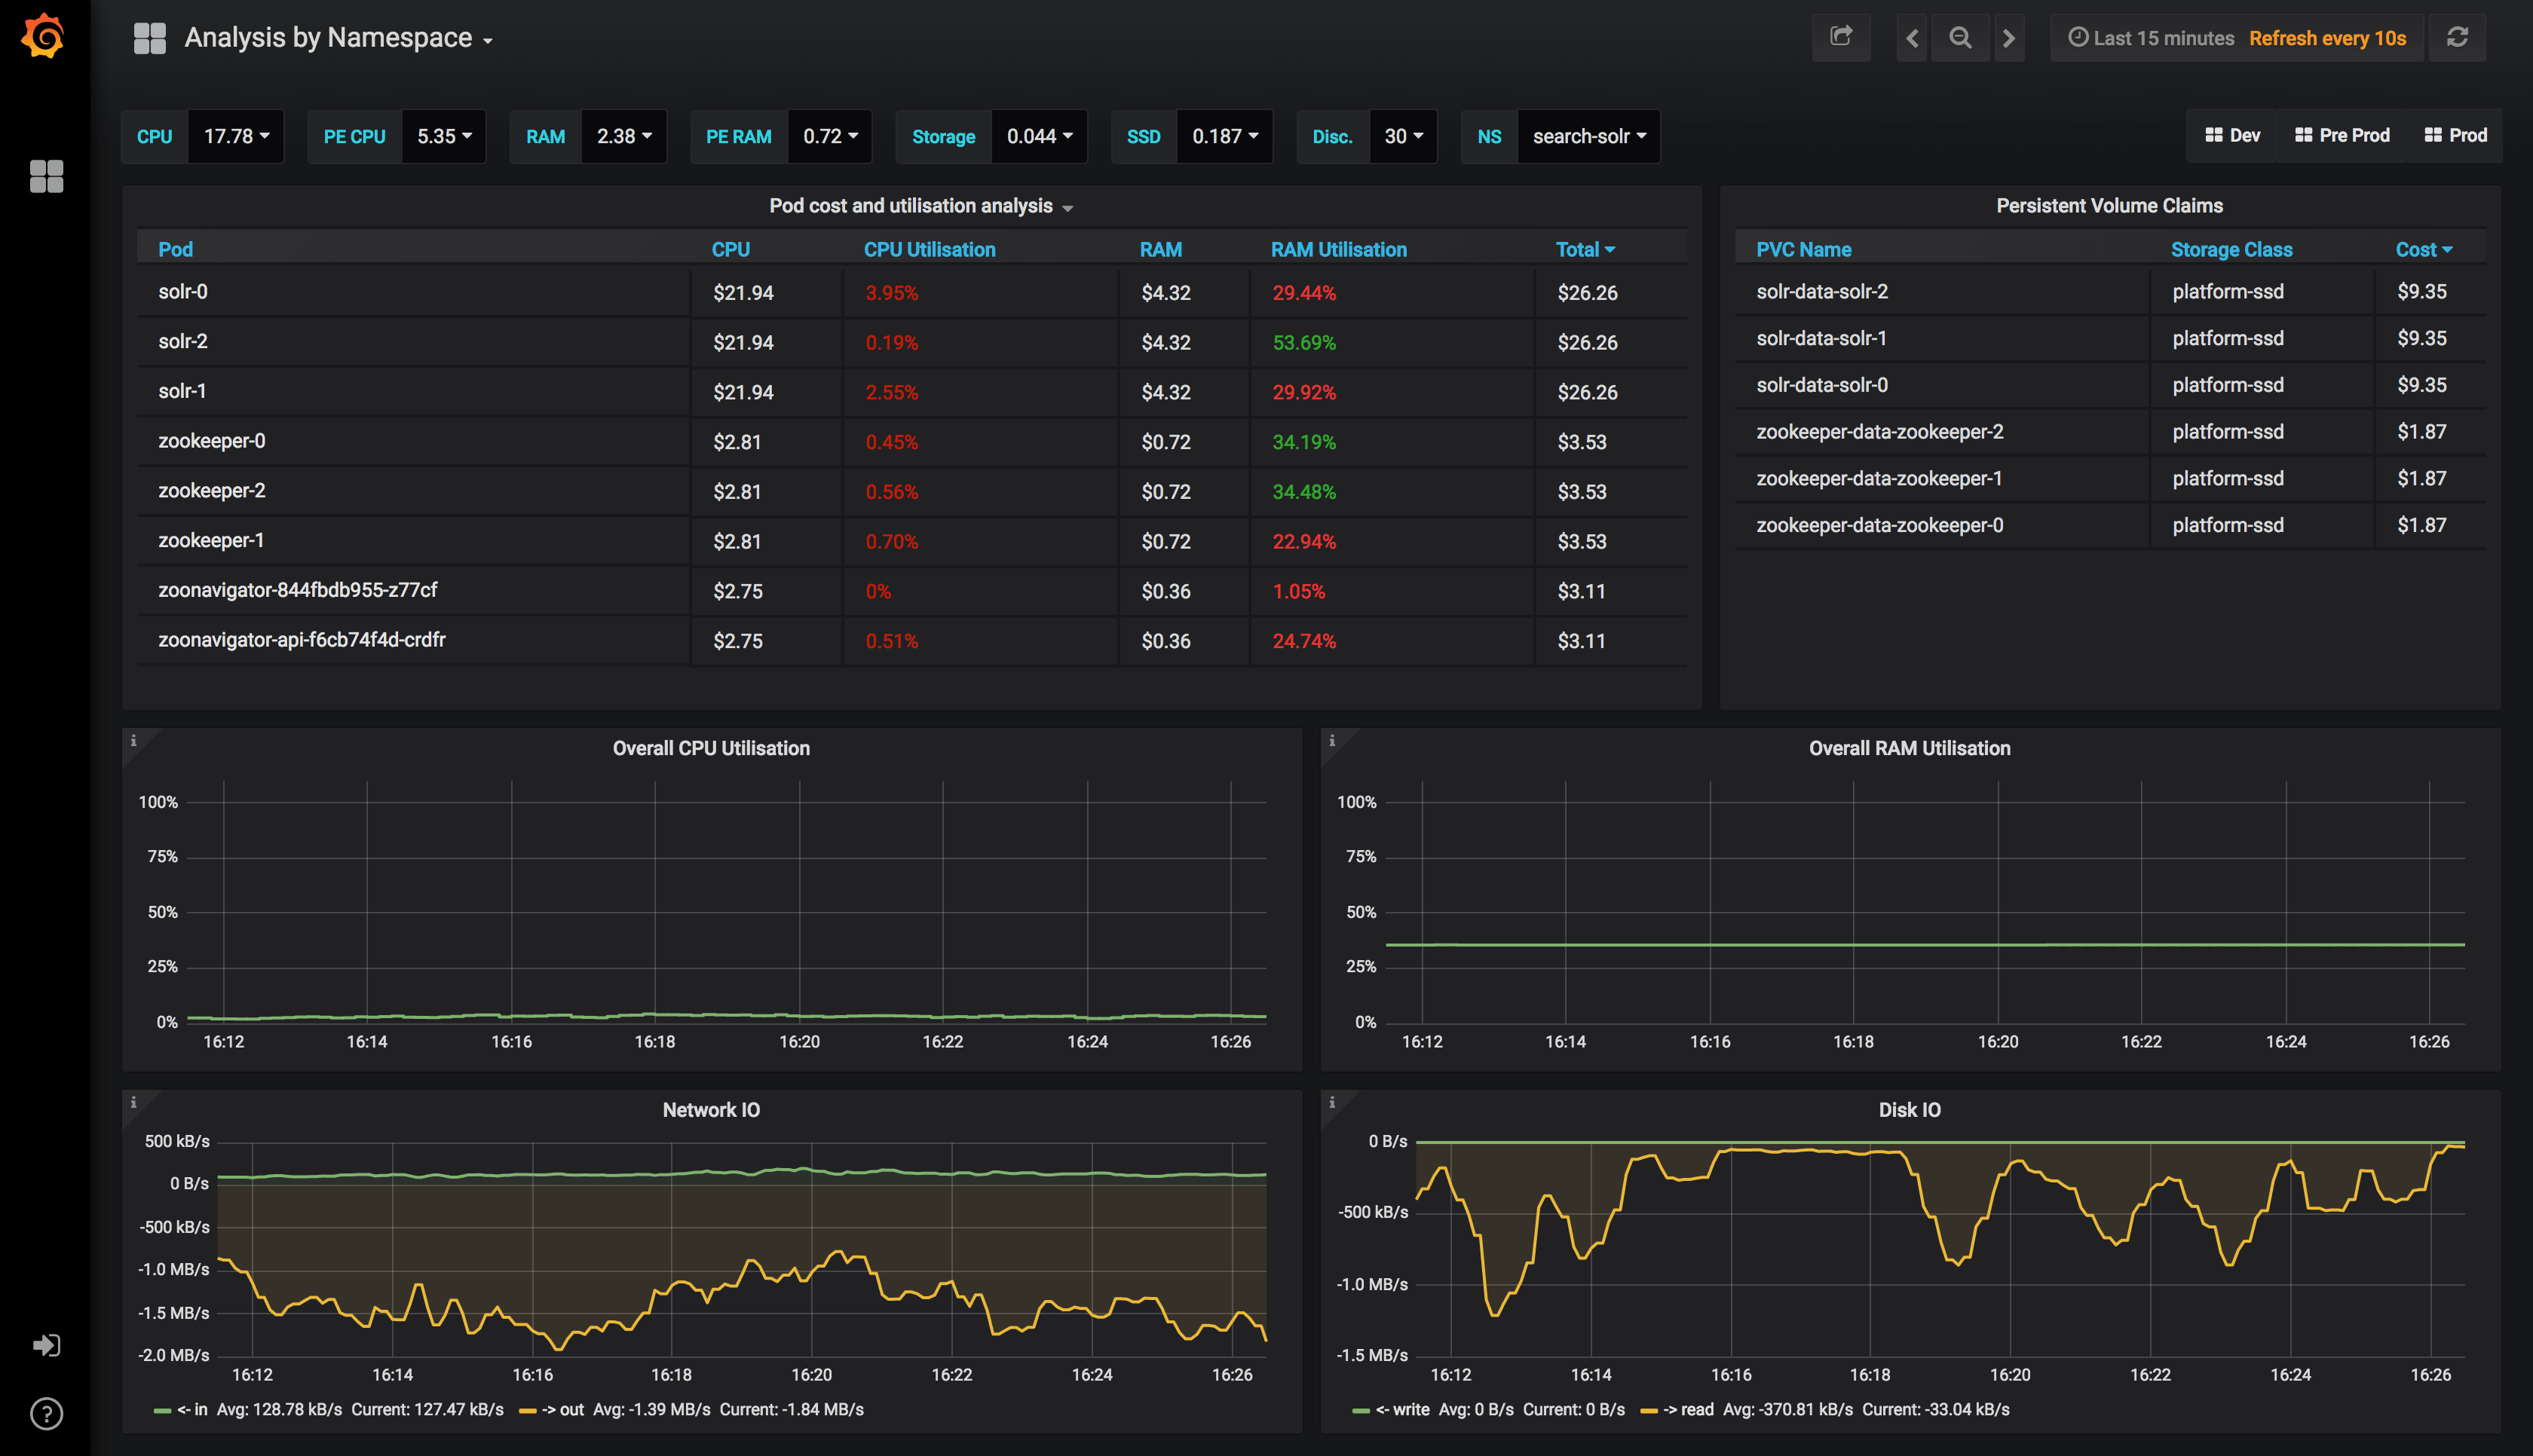
This dashboard can be clicked through from the Cluster dashboard, and gives you a namespace level view of the world with many of the same metrics from before.
get the dashboard on grafana.com
Pod Overview
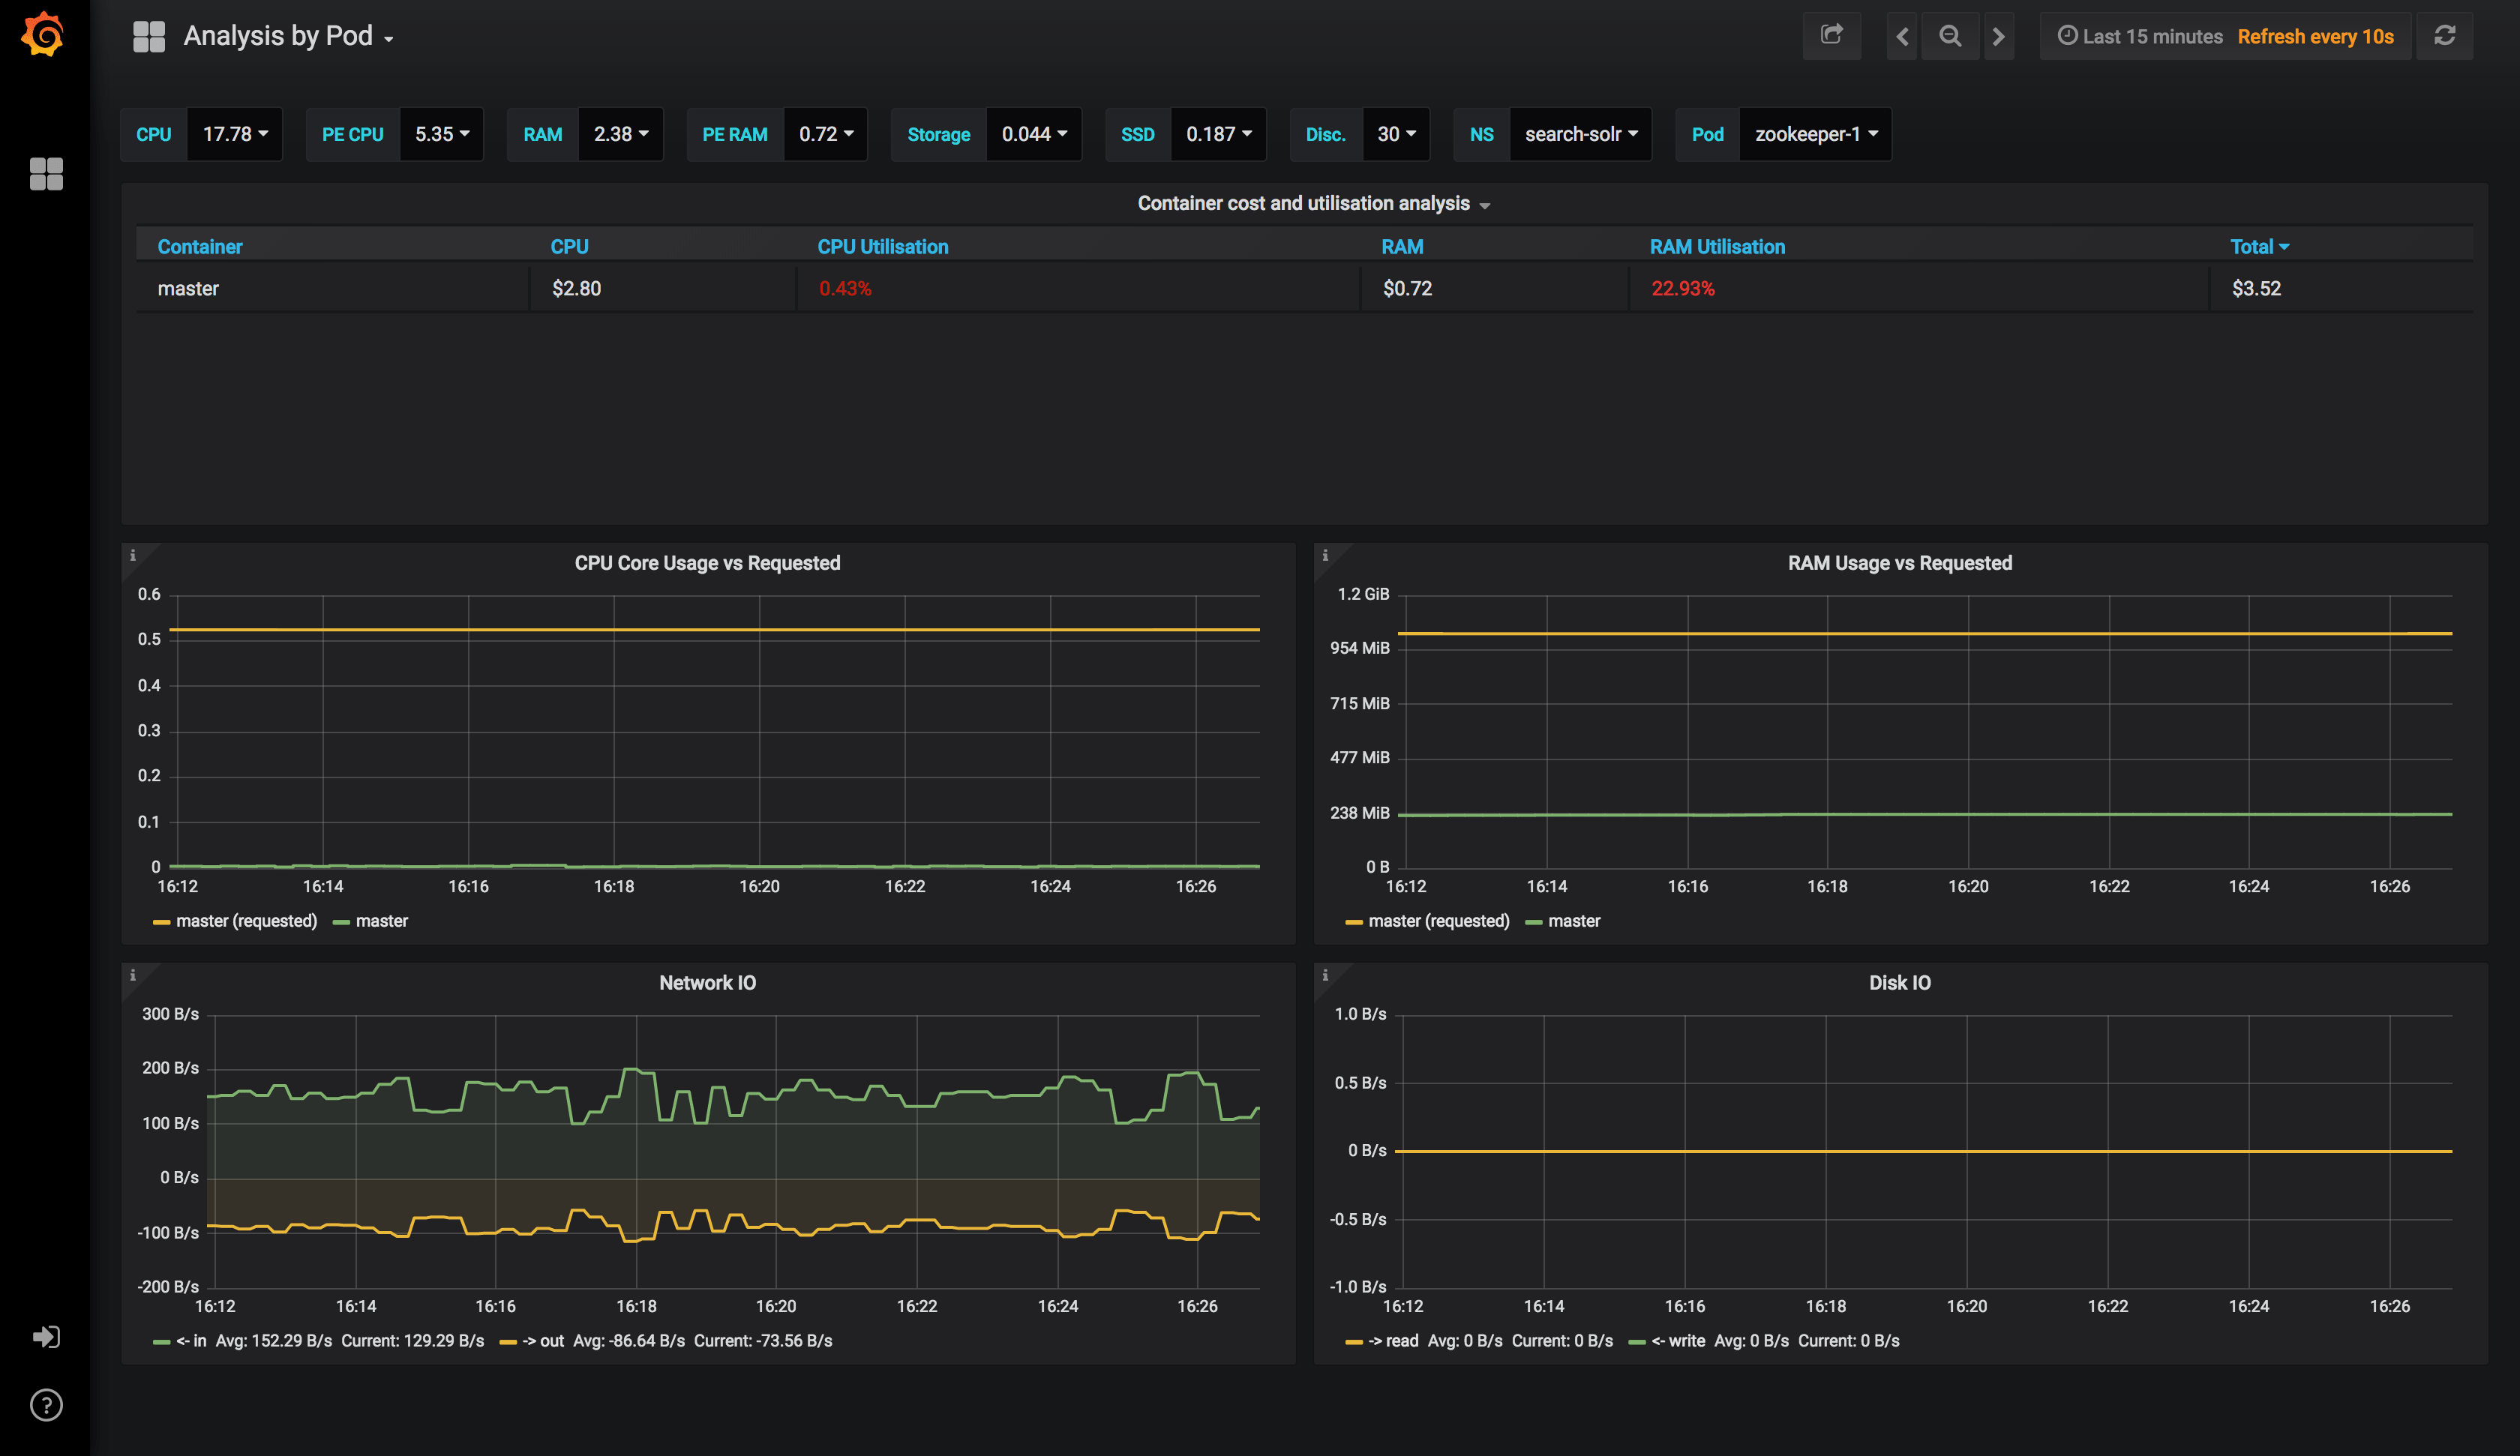
And finally, the pod level.
get the dashboard on grafana.com
Summary
We now have a one stop shop where people from all different areas of the business can go to understand, in great detail, what is running, and what it costs us. You could start to tie this in with service metrics such as those from Istio in order to have really informed decisions about the cost/value of an application/service.
Next step is to use the time series data to do predictive trend and cost analysis, but that's a task for another day!